Background Information
| Breed Card | |
| Breed | Zhangzhou Game chicken |
| Species taxonomy | Gallus gallus domesticus |
| Classification | Traditional |
| Region | China |
| Purpose | Fighting |
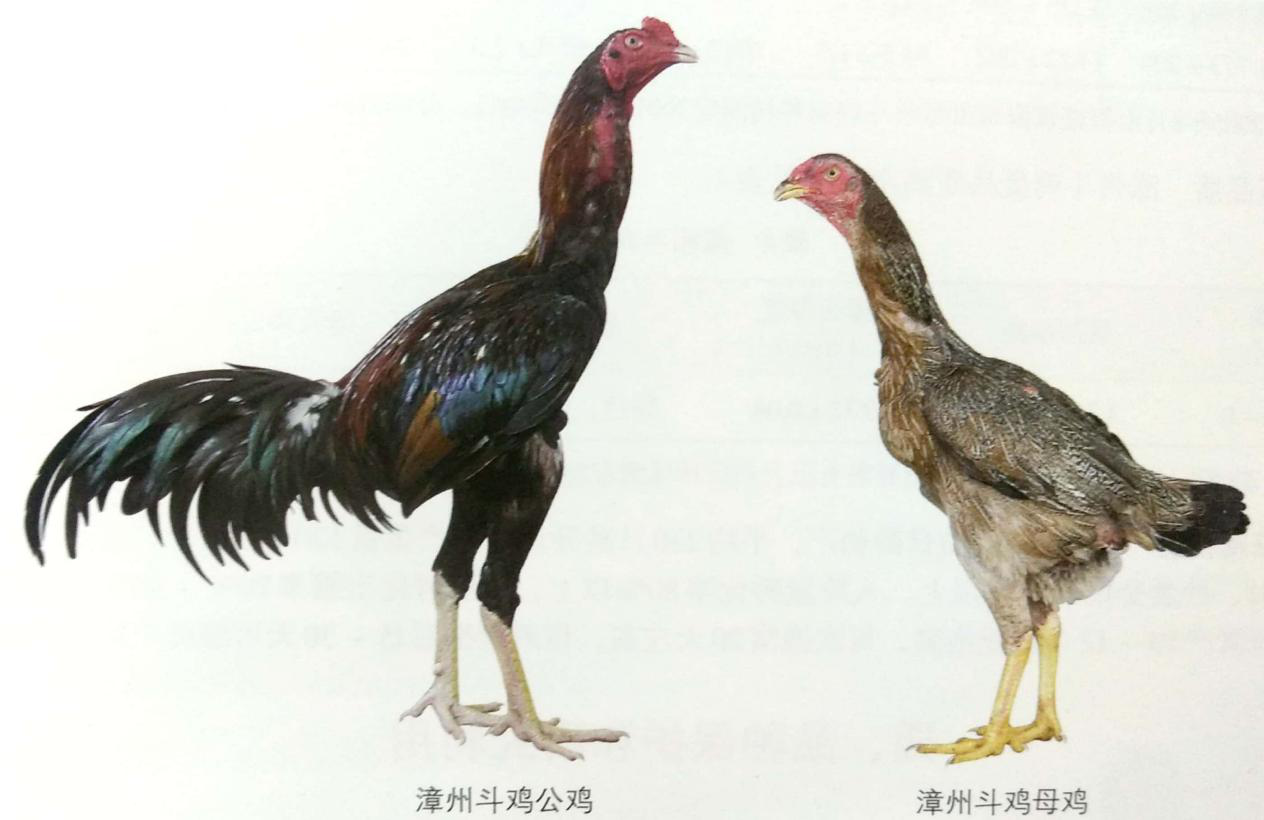
Zhangzhou Game chicken also known as Biting chicken, Fighting chicken and Military chicken, it is a ornamental type local breed. Zhangzhou Game chickens originated in Zhangzhou City, Fujian Province, China.The mainly distribution area are Xiangcheng District and Longhai City of Fujian, they also distributed in Xiamen, Quanzhou and other cities. In 2000, Zhangzhou Game chicken was included in the national conservation list of livestock and poultry species of China.
Zhangzhou Game chickens are tall with strong bones and strong muscles. Their beaks are yellowish-brown. The comb types are bean comb, and red in color. The skins are white. The shanks are yellow.The breasts of the cocks are broad and deep. The heads are small, the cheeks are tight, the beaks are thick, long and sharp, the necks are long and thick. The shanks are long and legs are strong. The feathers are sparse and cling to the body, and the feathers are usually reddish or yellow-brown, the neck feathers are dark red or golden, the back feathers are dark red (the base is red and the tip is golden), the chest feathers are black, and the tail feathers and the primary and secondary feathers are red mixed with black.The hen necks are thin, the bodies are long, the limbs are short. The colors of feathers are mainly brownish yellow, red brown. The colors are yellowish-brown from the backs to the tail feathers, the abdomens and necks are light yellow.Most chicks have reddish brown or yellow-brown stripes in the heads and the middle of backs, and with stripes on each side of the back line.
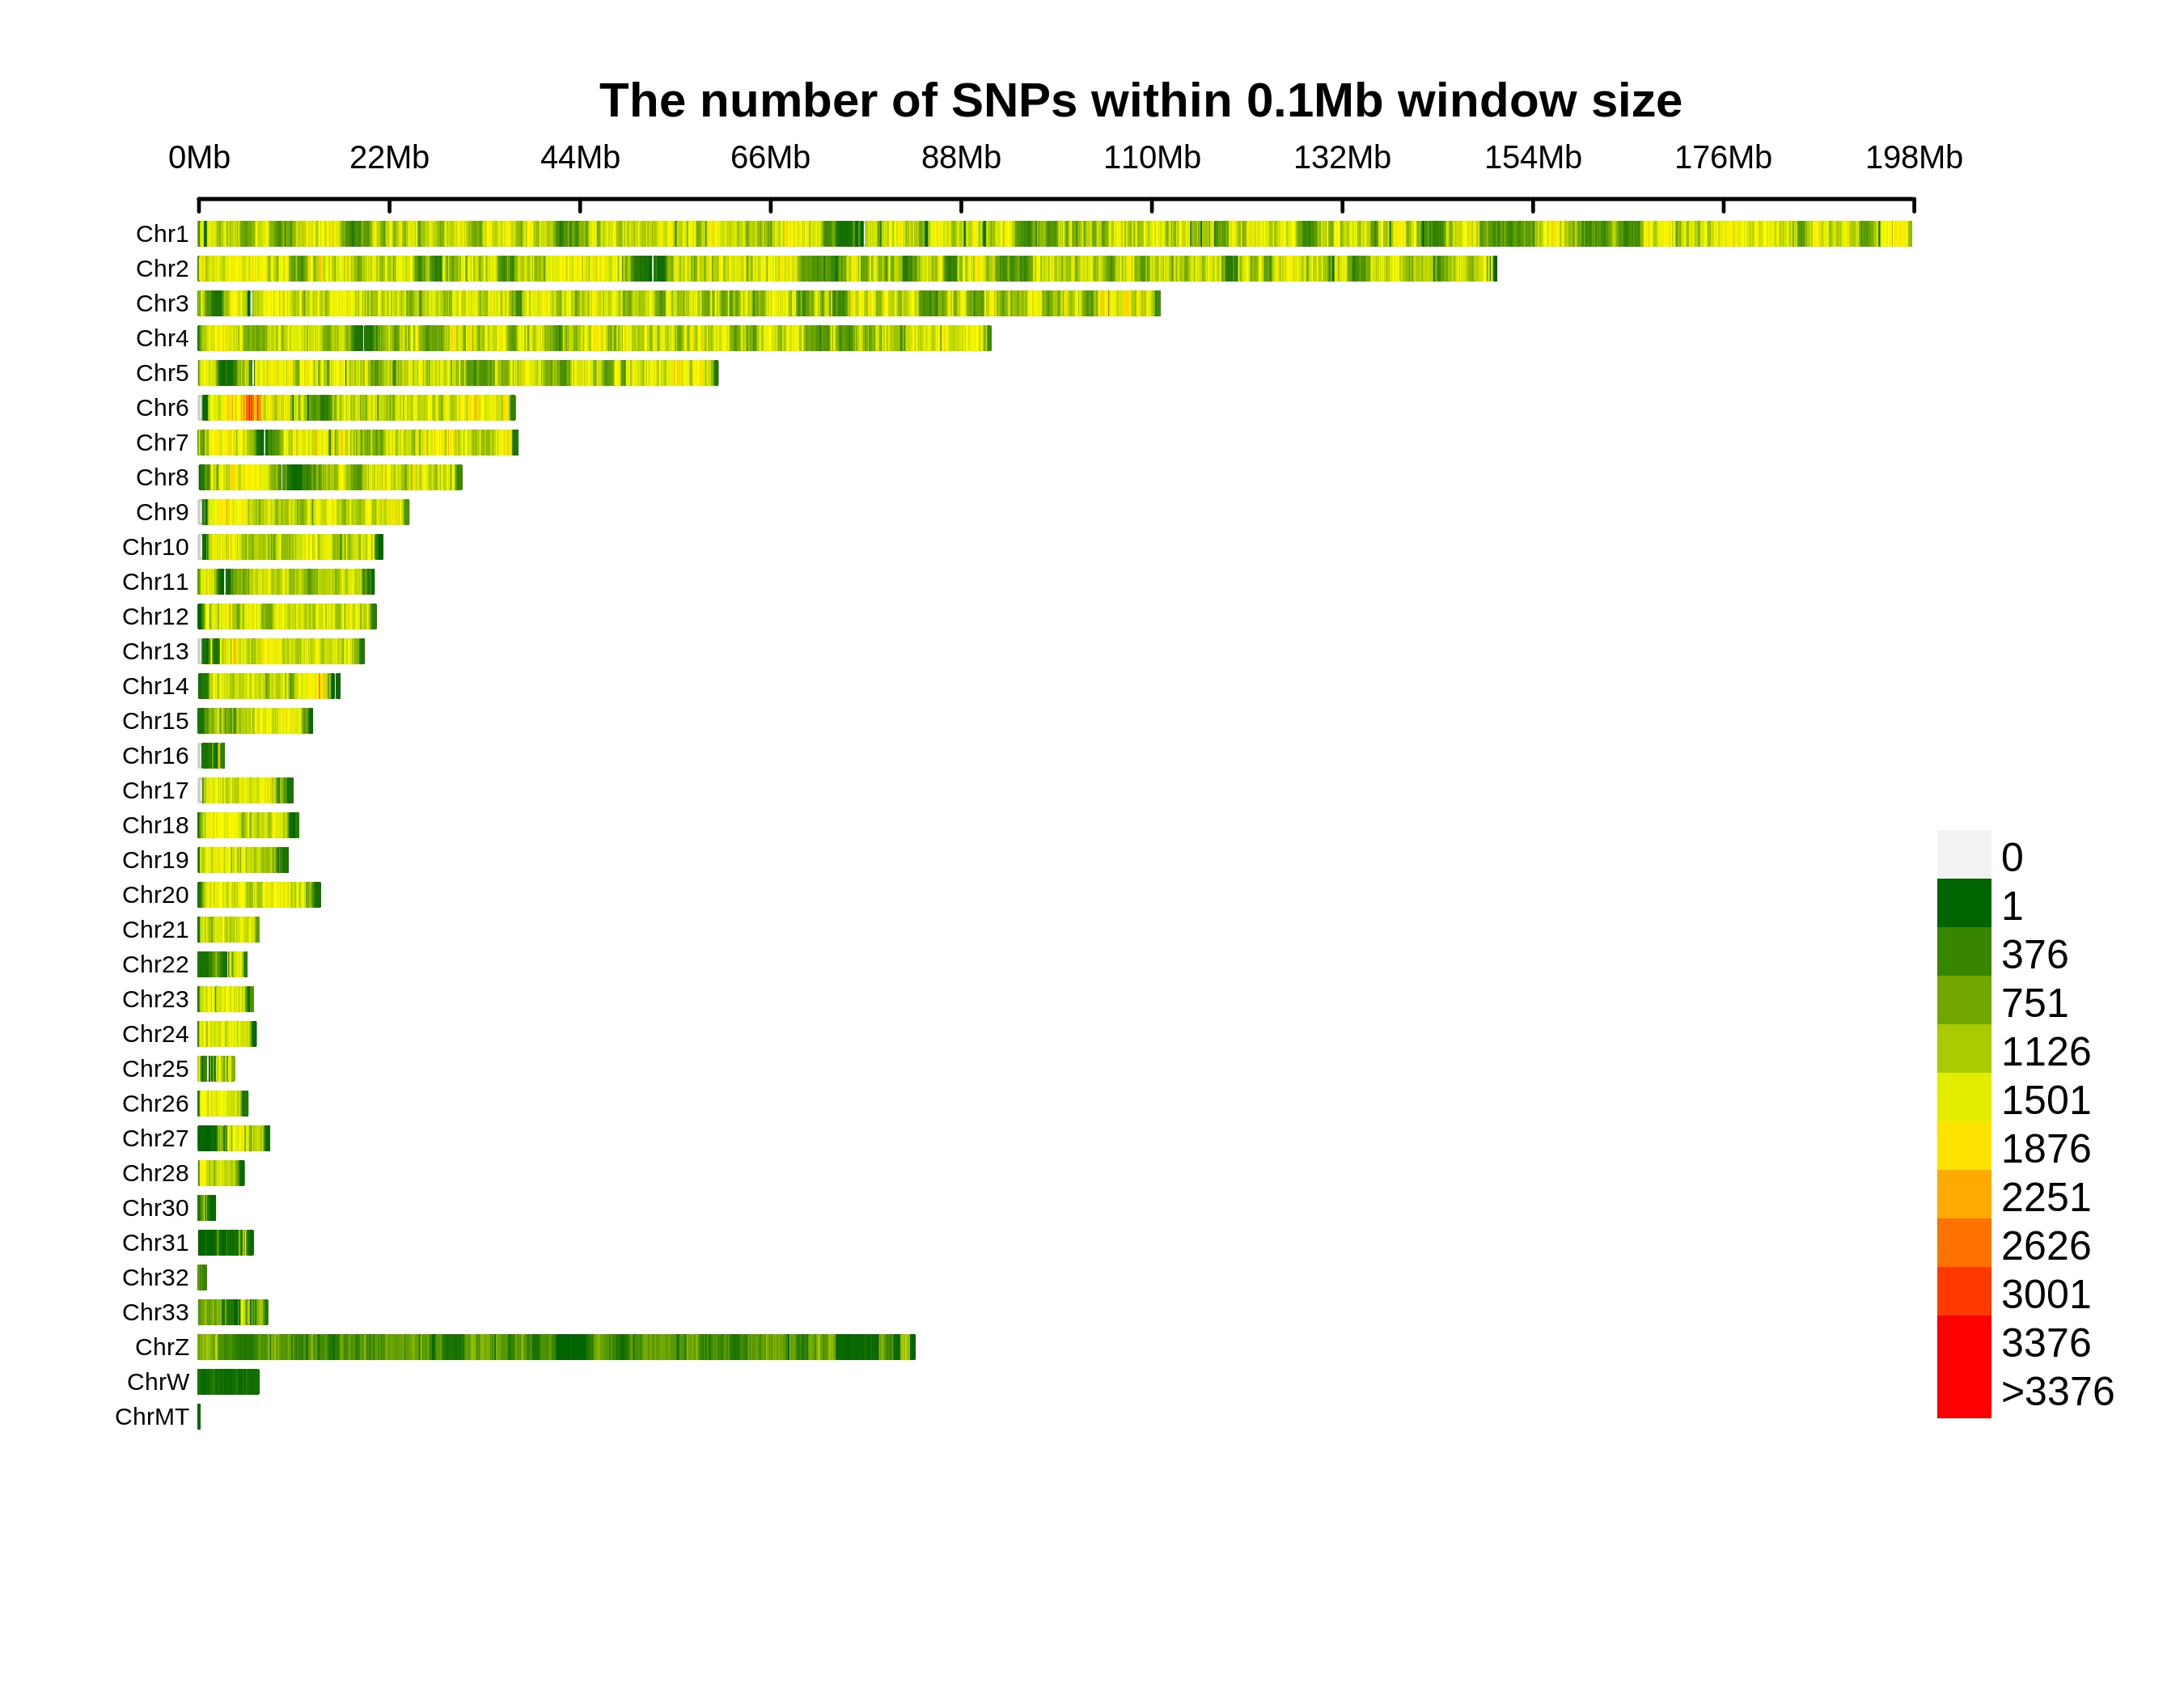
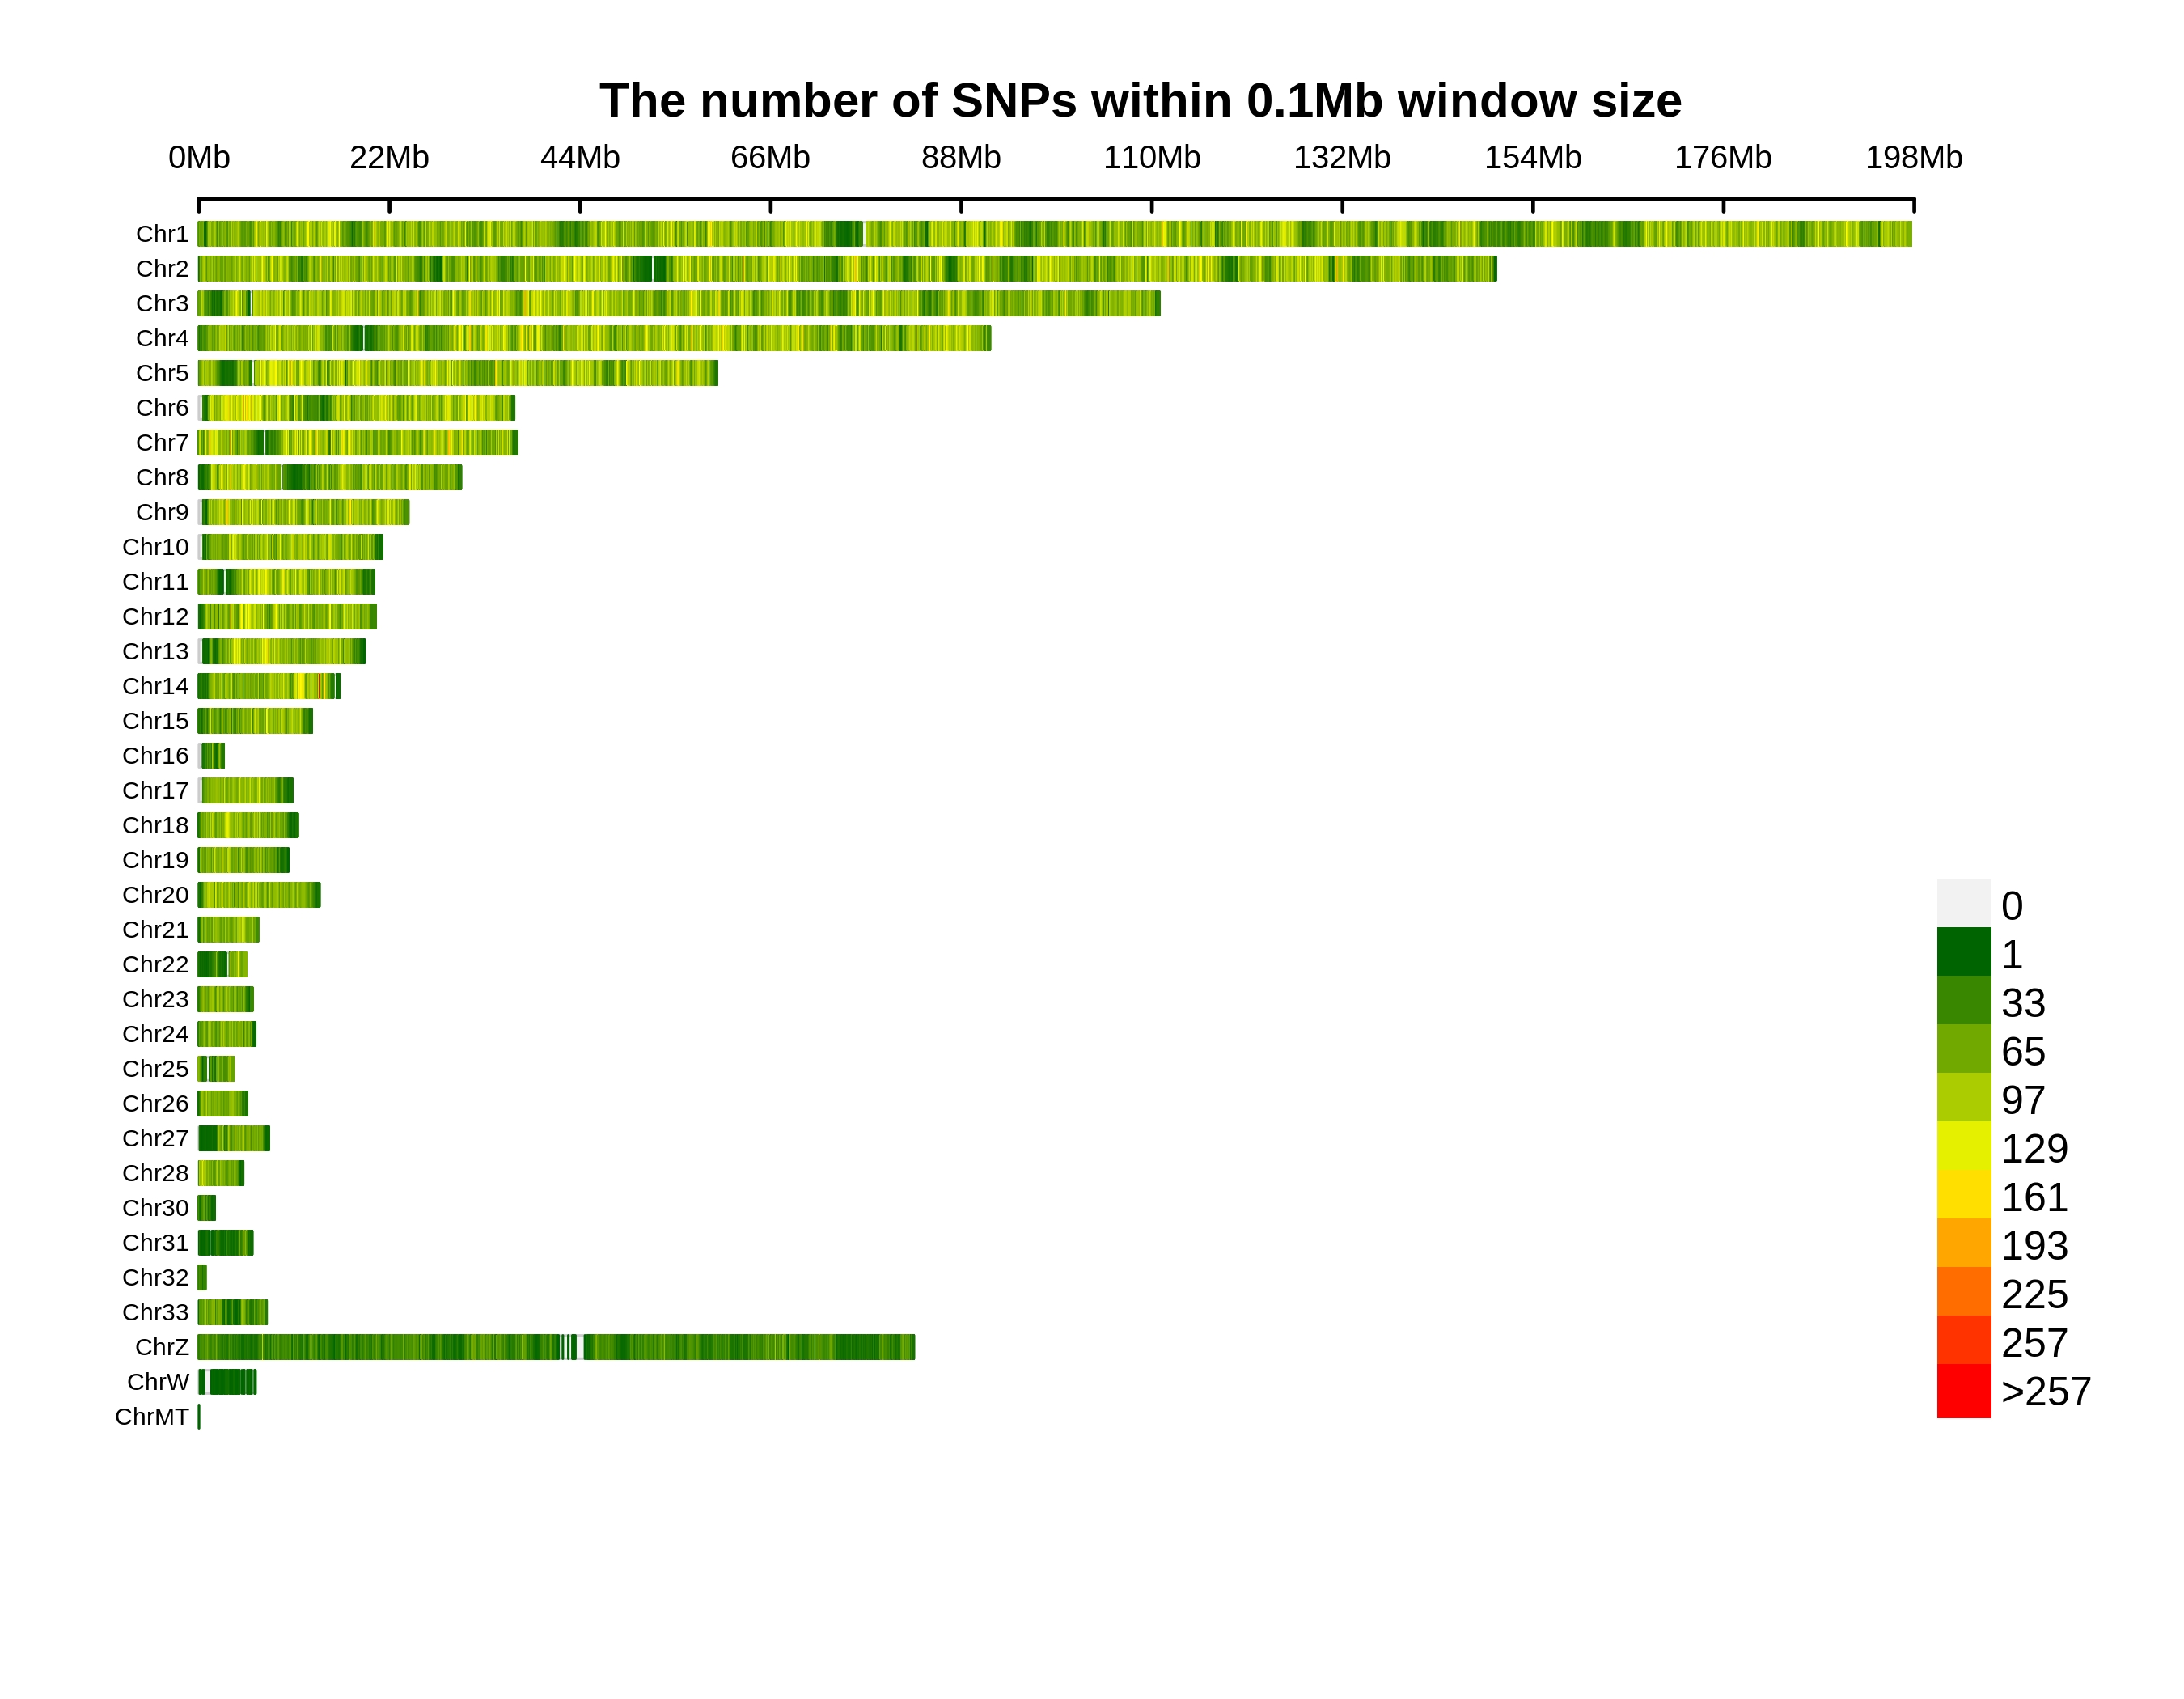
Variants Annotation&Density
| Annotation | Population SNP | Total SNP | Percentage SNP | Population INDEL | Total INDEL | Percentage INDEL |
|---|---|---|---|---|---|---|
| downstream | 150385 | 650455 | 23.12% | 12866 | 104154 | 12.3529% |
| exonic;splicing | 31 | 188 | 16.4894% | 0 | 0 | 0% |
| exonic_unknown | 25 | 582 | 4.2955% | 0 | 82 | 0% |
| frameshift_deletion | 0 | 0 | 0% | 653 | 15977 | 4.0871% |
| frameshift_insertion | 0 | 0 | 0% | 510 | 13308 | 3.8323% |
| intergenic | 3410754 | 15129055 | 22.5444% | 264134 | 2238383 | 11.8002% |
| intronic | 4297617 | 17735594 | 24.2316% | 352747 | 2641780 | 13.3526% |
| ncRNA_exonic | 90244 | 400185 | 22.5506% | 6471 | 54342 | 11.9079% |
| ncRNA_exonic;splicing | 68 | 231 | 29.4372% | 4 | 43 | 9.3023% |
| ncRNA_intronic | 857821 | 3728327 | 23.0082% | 70869 | 575920 | 12.3054% |
| ncRNA_splicing | 529 | 2341 | 22.5972% | 55 | 478 | 11.5063% |
| ncRNA_UTR5 | 0 | 0 | 0% | 2 | 18 | 11.1111% |
| nonframeshift_deletion | 0 | 0 | 0% | 382 | 8777 | 4.3523% |
| nonframeshift_insertion | 0 | 0 | 0% | 180 | 4784 | 3.7625% |
| nonsynonymous | 38542 | 336233 | 11.4629% | 0 | 0 | 0% |
| splice_acceptor | 86 | 750 | 11.4667% | 65 | 964 | 6.7427% |
| splice_donor | 117 | 1076 | 10.8736% | 27 | 763 | 3.5387% |
| splice_donor_acceptor | 0 | 0 | 0% | 8 | 45 | 17.7778% |
| splice_UTR5 | 66 | 400 | 16.5% | 9 | 106 | 8.4906% |
| splie_Others | 0 | 0 | 0% | 39 | 654 | 5.9633% |
| startloss | 130 | 671 | 19.3741% | 1 | 51 | 1.9608% |
| stopgain | 395 | 4175 | 9.4611% | 14 | 1252 | 1.1182% |
| stoploss | 68 | 353 | 19.2635% | 3 | 63 | 4.7619% |
| synonymous | 90865 | 548813 | 16.5566% | 0 | 0 | 0% |
| upstream | 152302 | 679592 | 22.4108% | 11268 | 98760 | 11.4095% |
| upstream;downstream | 12656 | 57451 | 22.0292% | 1004 | 9367 | 10.7185% |
| UTR3 | 75855 | 361040 | 21.0101% | 7008 | 61415 | 11.4109% |
| UTR5 | 20974 | 112990 | 18.5627% | 1361 | 16935 | 8.0366% |
| UTR5;UTR3 | 501 | 2524 | 19.8494% | 52 | 381 | 13.6483% |
| Total | 9200031 | 39753026 | 23.143% | 729732 | 5848802 | 12.4766% |
Genetic Differentiation
Summary
Genetic affinities of target population in the context of worldwide populations are measured by pairwise FST between target population and references. Smaller FST value indicates closer relationship. Regions represented by different colors are indicated above.
Genetic Affinity
Summary
Genetic affiliation and population structure are shown by PCA plots. After removing G. g. bankiva, G. g. jabouillei, and some G. g. gallus individuals as outliers to other Red Jungle Fowl, the dataset contains 1,915 samples from domestic chicken and Red Jungle Fowl. User can add any populations with interests to show with the target population under this PCA context by using the item of “Add”.
ADMIXTURE Analysis
Summary
The inference of populations and individual ancestries is revealed by ADMIXTURE clustering. Length of each colored bar represents the proportion of proposed ancestry in the sample. User can add any populations with interests to compare with the target population by using the item of “Add”. The number of proposed ancestries is determined by “which K”.
Runs of Homozygosity
Summary
Runs of homozygosity (ROH) indicates long tracts of homozygous genotypes inherited from identical haplotypes of a common ancestor. Larger populations have fewer, shorter ROH, whereas isolated or bottlenecked populations have more, somewhat longer ROH. Admixture brings the fewest ROH, whereas inbreeding causes long ROH. The level of ROH is measured by number and length. The length of ROH can be defined in “ROH range”. User can add any populations with interests to compare with the target population by using the item of “Add”.
Linkage Disequilibrium Decay
Summary
Linkage disequilibrium (LD) decay is characterized by squared correlations (r²) of all SNPs frequencies against the physical distances between SNPs. User can add any populations with interests to compare with the target population by using the item of “Add”.
Demographic History
Summary
The changes of effective population size through time is inferred by SMC++. User can add any populations with interests to compare with the target population by using the item of “Add”.
Selection
Summary
Selective signals of the target population are detected by different methods. X axis indicates physical position of specific chromosomal region with interests which can be defined by “Region”. The gene annotation is shown below. Y axis of left (YL) indicates the values of Pi-ratio of -log2(πRJF/πTarget) or composite likelihood ratio (CLR) of SweeD. The levels of statistical significance are noted with different colors. Y axis of right (YR) shows the values of Fst (Target vs. Red Jungle Fowl), Pi, or Tajima’s D with blue line with sliding window approach. The genomic window size and step size for Tajima’s D are 5 kb and 5 kb, respectively. The genomic window size and step size for Fst and Pi are 10 kb and 5 kb, respectively. The methods are defined by “Method-YL” and “Method-YR”.
