Background Information
| Breed Card | |
| Breed | Modern Game |
| Species taxonomy | Gallus gallus domesticus |
| Classification | Commercial |
| Region | England |
| Purpose | Fighting |
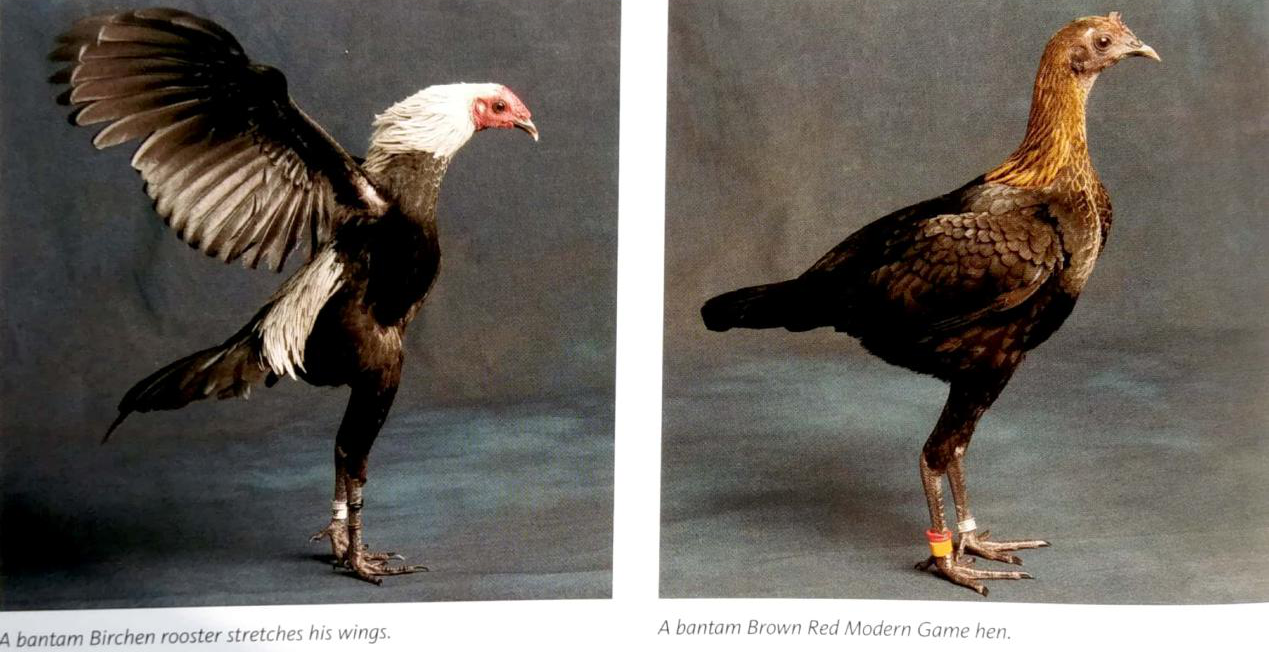
The Modern Game is a breed that got developed in Britain. They actually resulted from breeding Malays with Old English Games, shortly after 1849 ban on cockingfighting in Great Britain. Breeders were more interested in looks than fighting qualities. As the years went by, the show scene made certain characteristics more desirable: taller birds and hard feathering for example that were required if an exhibitor were to win one of the top prizes. By about 1870, the chickens were being called "Exhibition Game" By 1910, they were being called Modern Game.
Modern Games are very tall birds. The bird has a relatively short back, fine tail, hard feathering, and a very upright carriage. The Modern Game appears in a lot of color-varieties. It has a single comb, red earlobes and mostly slate-blue legs. Modern Game hens lay around (50 - 80) tinted white eggs per year, and they tend to go broody. The roosters weigh 3.2 - 4.1 kg; and the hens weigh 2.25 - 3.2 kg.
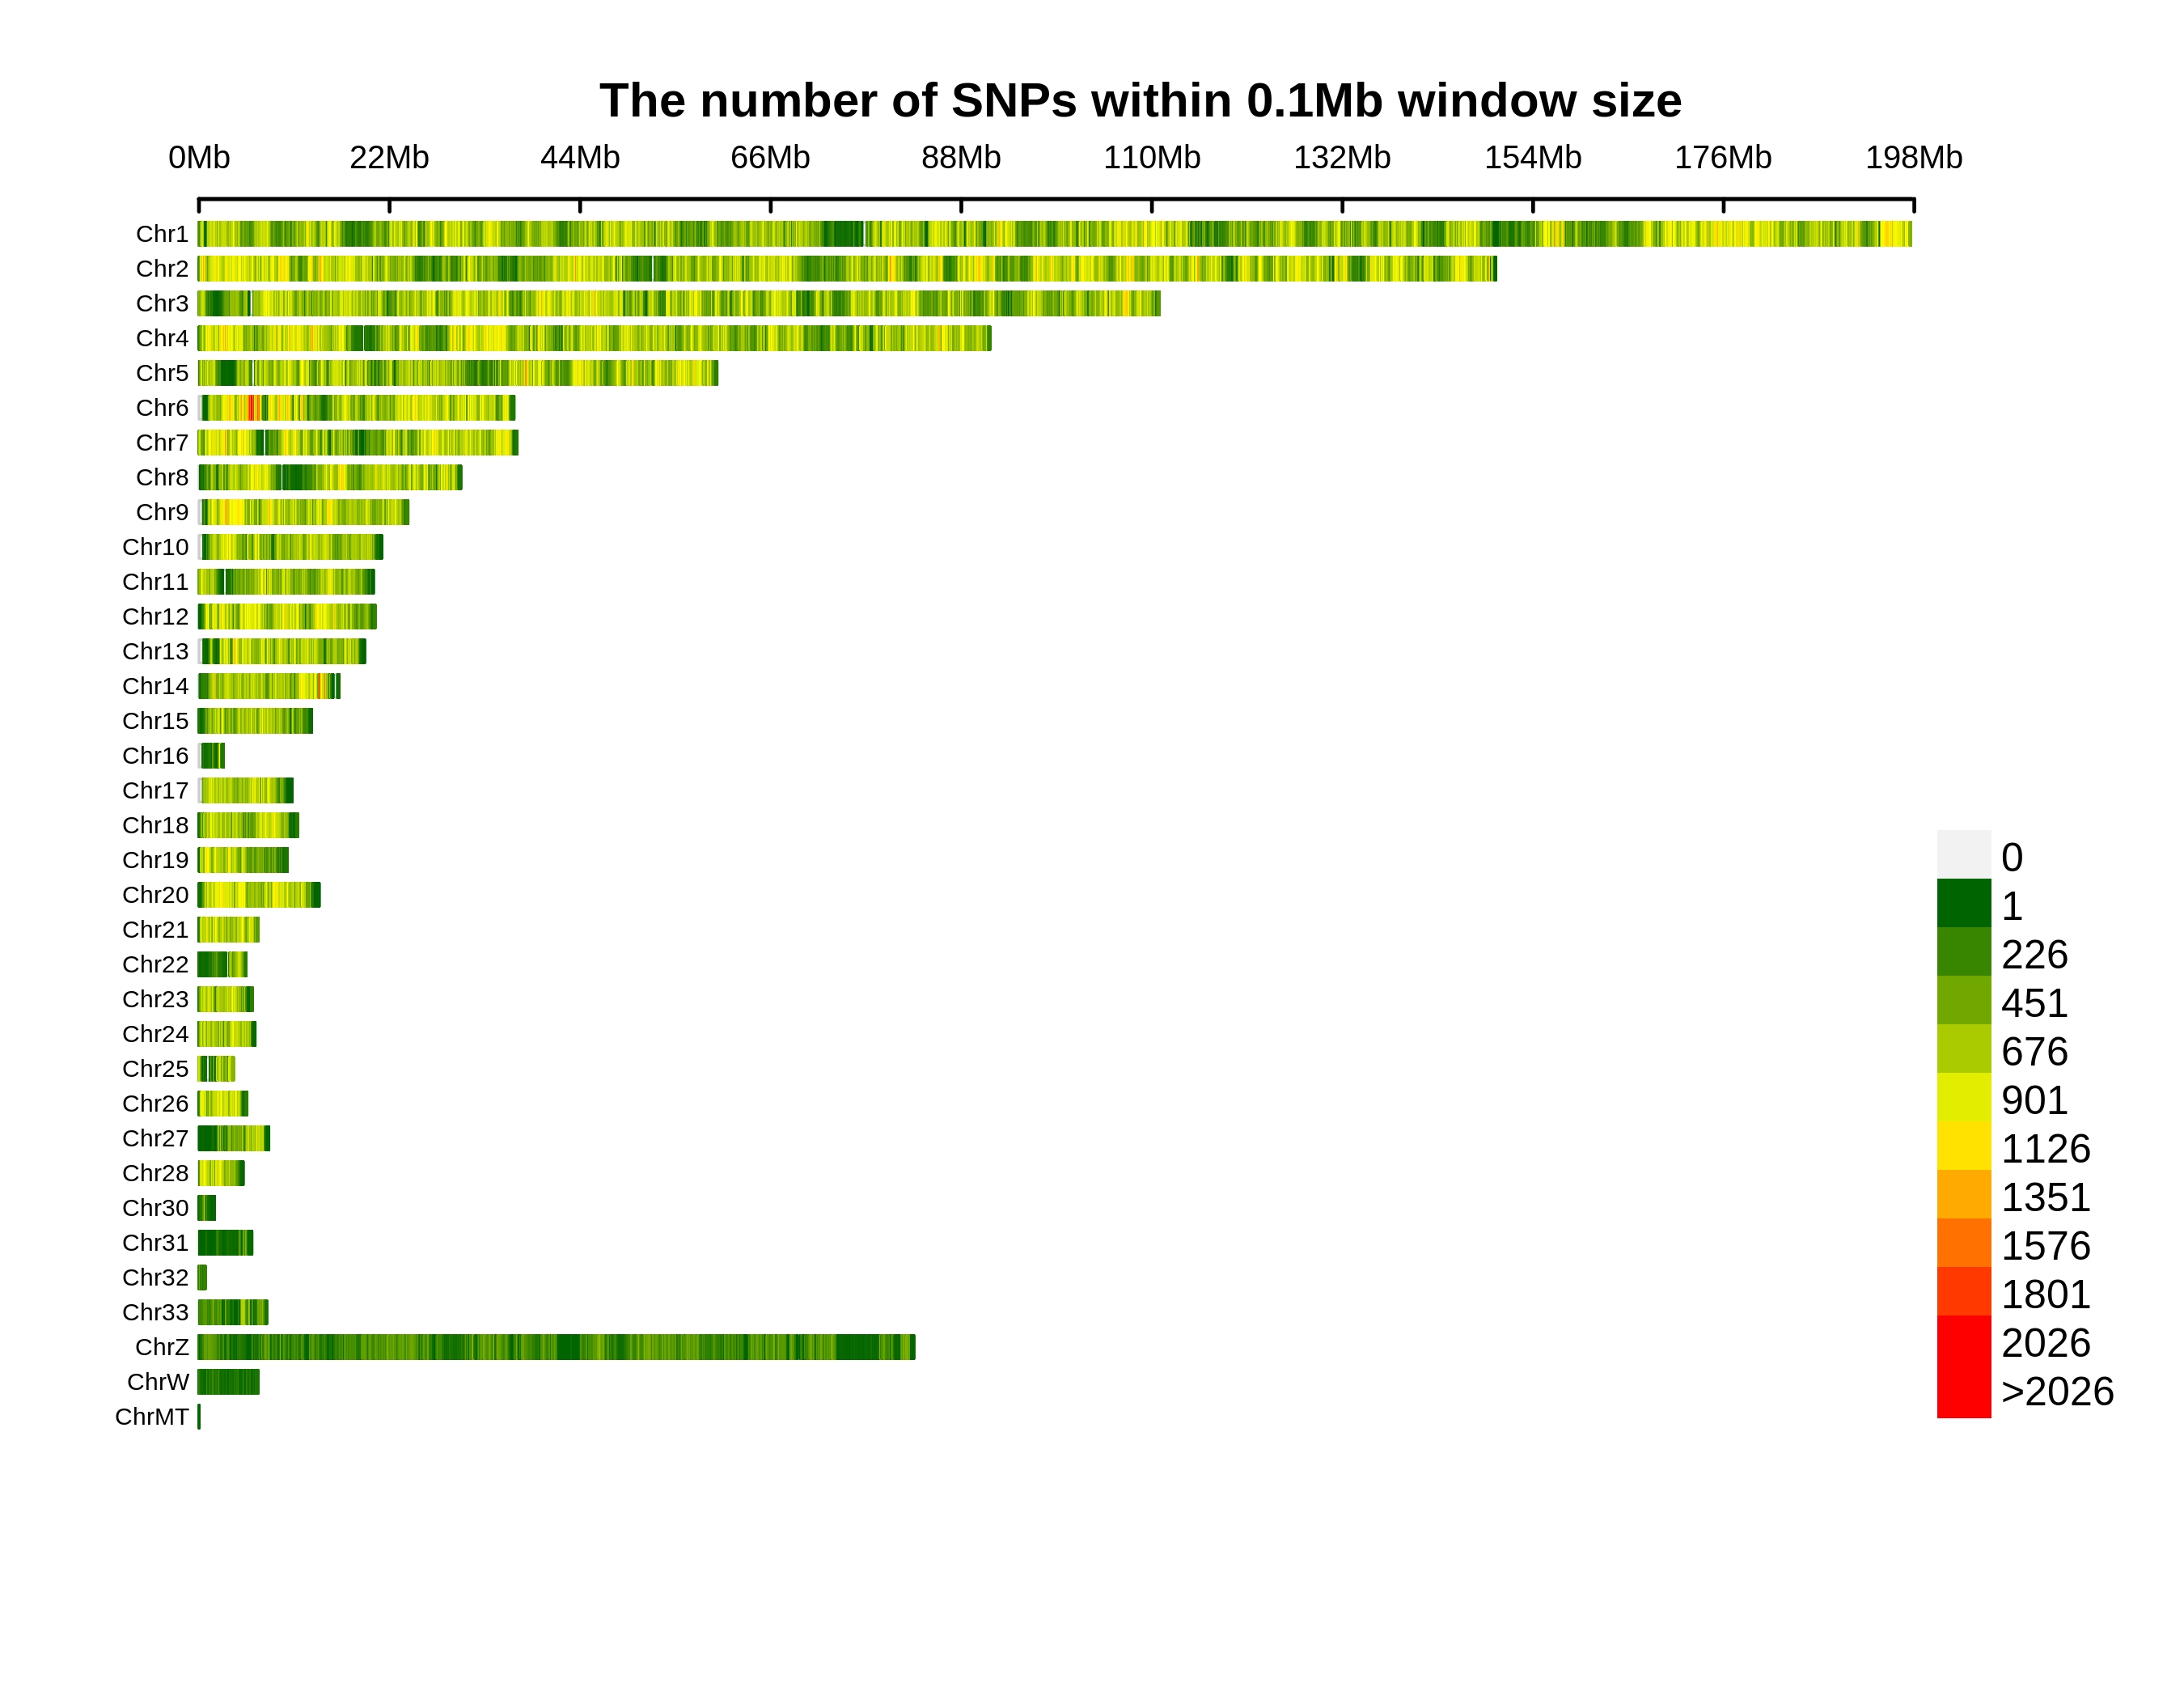
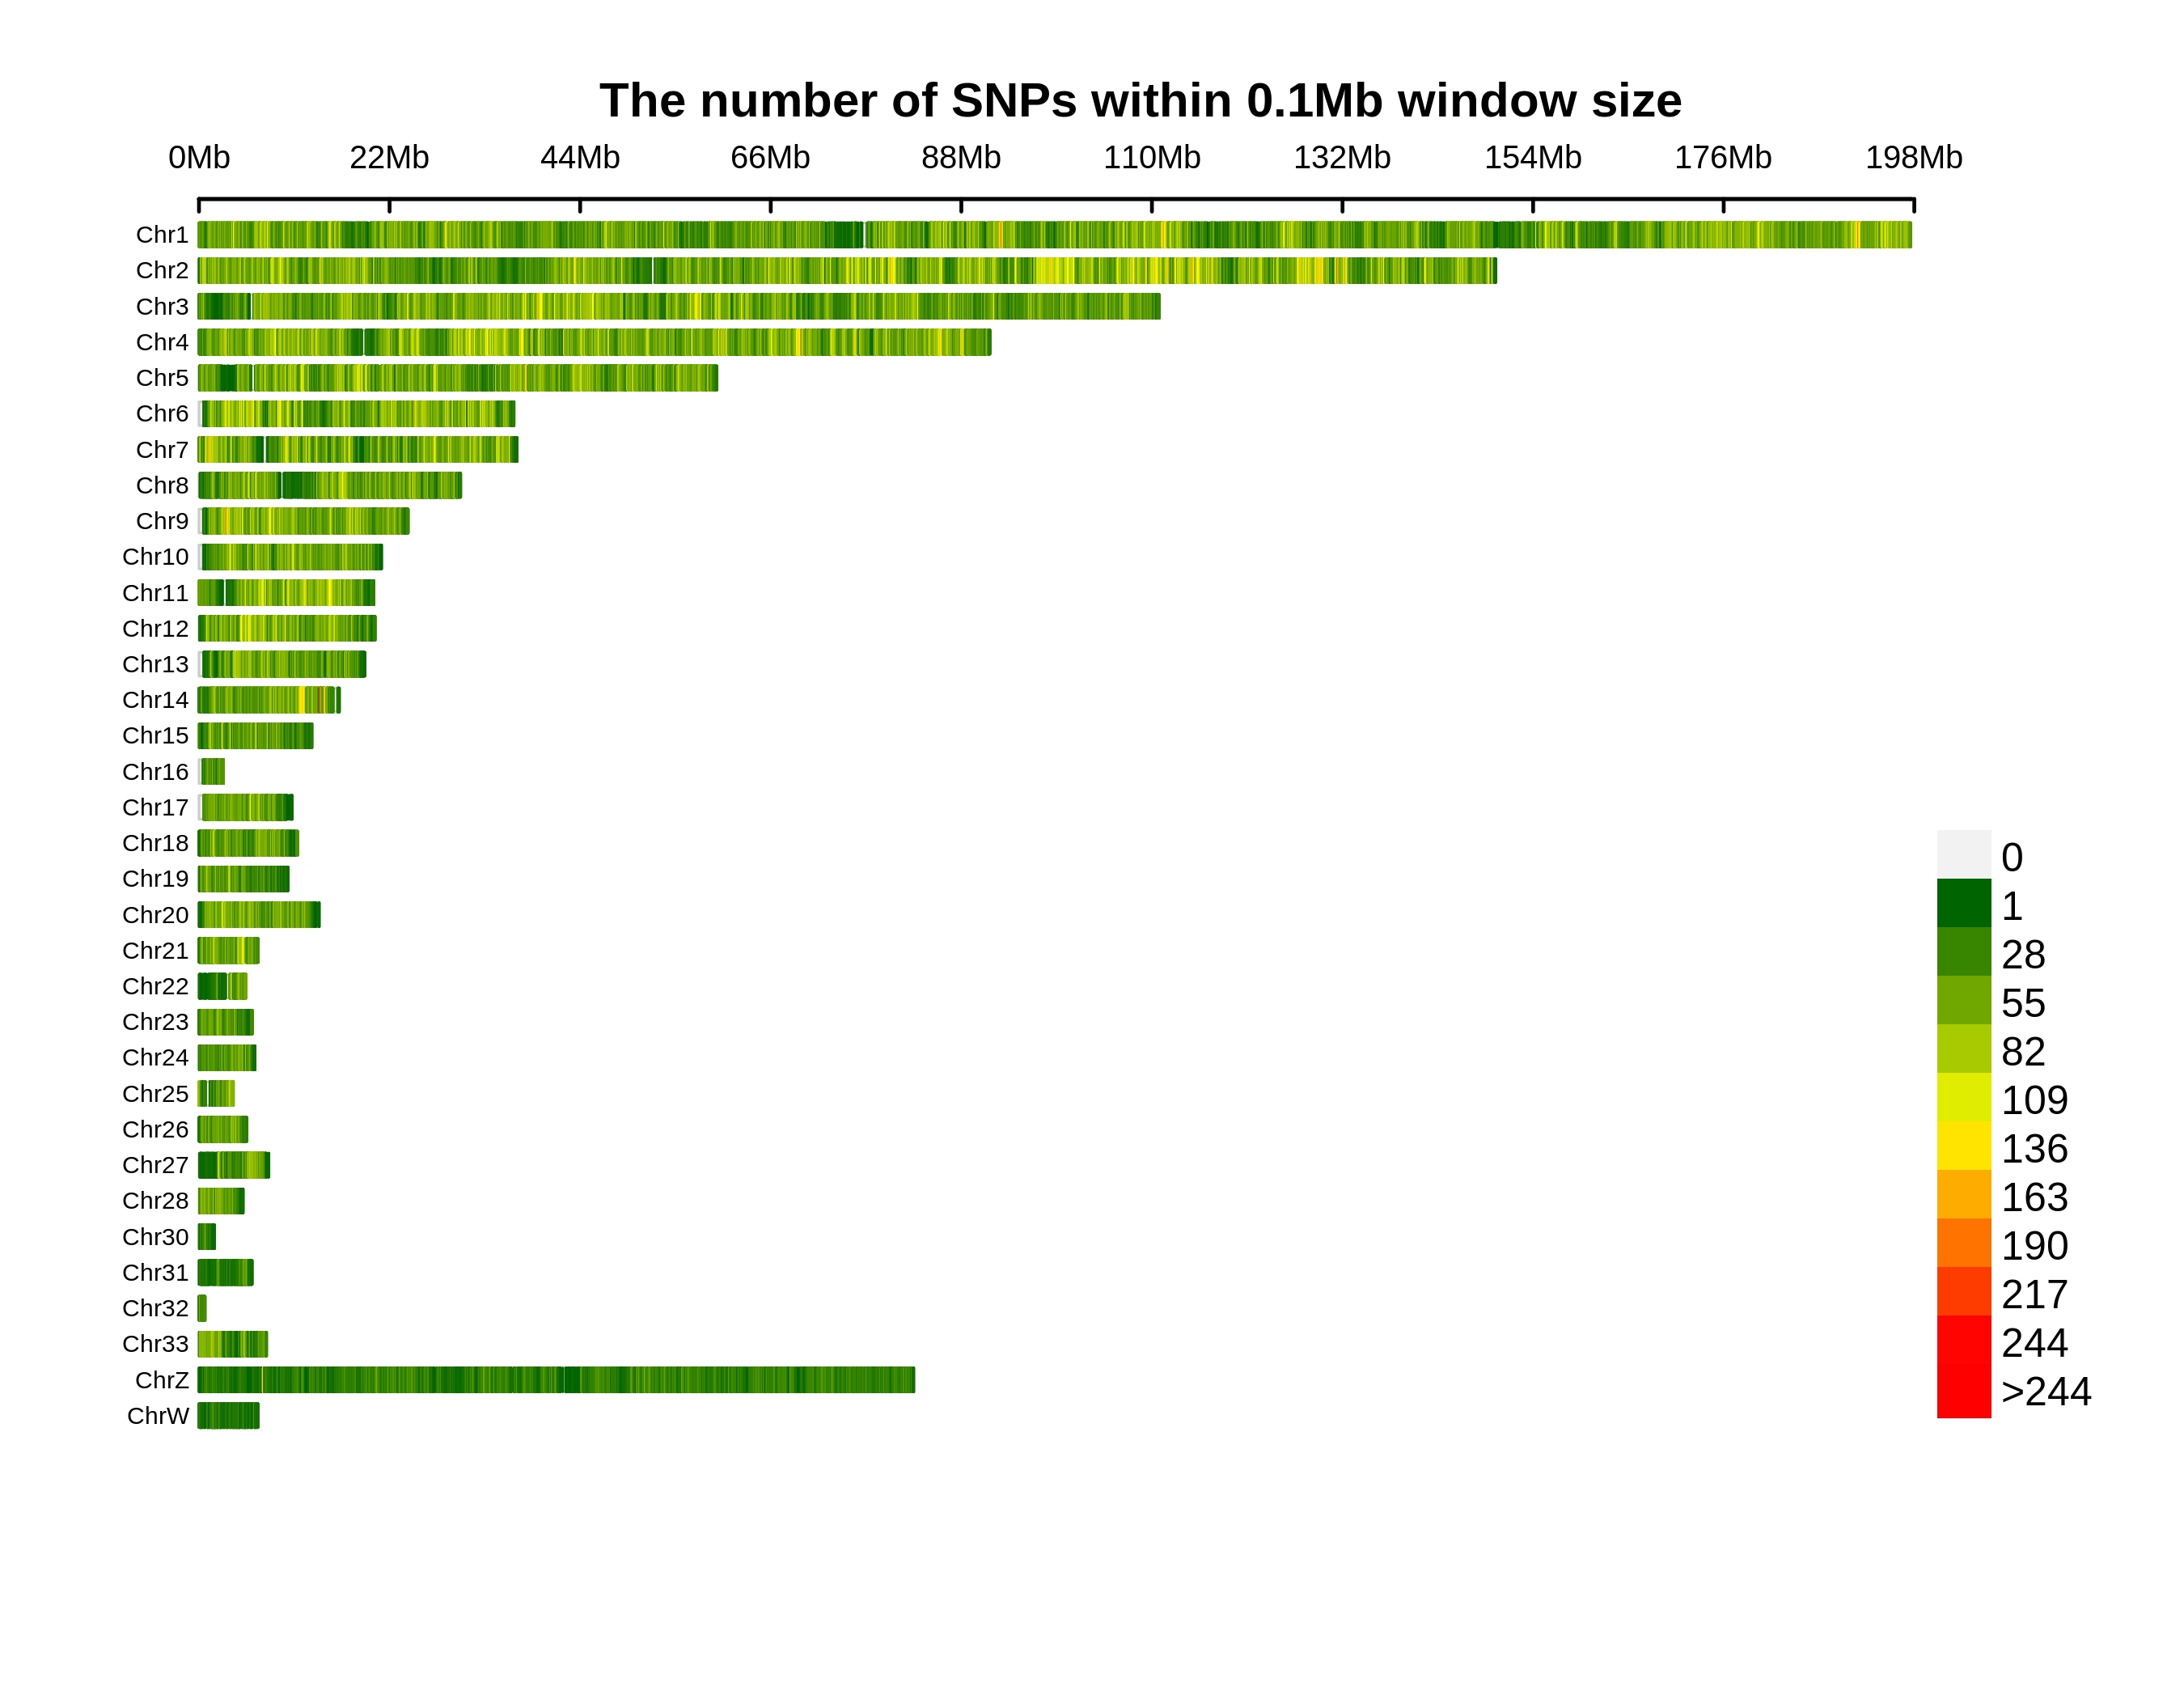
Variants Annotation&Density
| Annotation | Population SNP | Total SNP | Percentage SNP | Population INDEL | Total INDEL | Percentage INDEL |
|---|---|---|---|---|---|---|
| downstream | 96754 | 650455 | 14.8748% | 9028 | 104154 | 8.6679% |
| exonic;splicing | 21 | 188 | 11.1702% | 0 | 0 | 0% |
| exonic_unknown | 5 | 582 | 0.8591% | 0 | 82 | 0% |
| frameshift_deletion | 0 | 0 | 0% | 554 | 15977 | 3.4675% |
| frameshift_insertion | 0 | 0 | 0% | 532 | 13308 | 3.9976% |
| intergenic | 2196055 | 15129055 | 14.5155% | 187284 | 2238383 | 8.3669% |
| intronic | 2744760 | 17735594 | 15.476% | 243299 | 2641780 | 9.2097% |
| ncRNA_exonic | 57934 | 400185 | 14.4768% | 4355 | 54342 | 8.0141% |
| ncRNA_exonic;splicing | 45 | 231 | 19.4805% | 4 | 43 | 9.3023% |
| ncRNA_intronic | 551056 | 3728327 | 14.7802% | 49647 | 575920 | 8.6205% |
| ncRNA_splicing | 346 | 2341 | 14.78% | 41 | 478 | 8.5774% |
| ncRNA_UTR5 | 0 | 0 | 0% | 1 | 18 | 5.5556% |
| nonframeshift_deletion | 0 | 0 | 0% | 305 | 8777 | 3.475% |
| nonframeshift_insertion | 0 | 0 | 0% | 140 | 4784 | 2.9264% |
| nonsynonymous | 24855 | 336233 | 7.3922% | 0 | 0 | 0% |
| splice_acceptor | 49 | 750 | 6.5333% | 58 | 964 | 6.0166% |
| splice_donor | 63 | 1076 | 5.855% | 23 | 763 | 3.0144% |
| splice_donor_acceptor | 0 | 0 | 0% | 15 | 45 | 33.3333% |
| splice_UTR5 | 47 | 400 | 11.75% | 5 | 106 | 4.717% |
| splie_Others | 0 | 0 | 0% | 30 | 654 | 4.5872% |
| startloss | 87 | 671 | 12.9657% | 4 | 51 | 7.8431% |
| stopgain | 259 | 4175 | 6.2036% | 14 | 1252 | 1.1182% |
| stoploss | 49 | 353 | 13.881% | 4 | 63 | 6.3492% |
| synonymous | 57964 | 548813 | 10.5617% | 0 | 0 | 0% |
| upstream | 98947 | 679592 | 14.5598% | 8148 | 98760 | 8.2503% |
| upstream;downstream | 8289 | 57451 | 14.4279% | 721 | 9367 | 7.6972% |
| UTR3 | 47904 | 361040 | 13.2683% | 4828 | 61415 | 7.8613% |
| UTR5 | 13856 | 112990 | 12.263% | 1070 | 16935 | 6.3183% |
| UTR5;UTR3 | 322 | 2524 | 12.7575% | 33 | 381 | 8.6614% |
| Total | 5899667 | 39753026 | 14.8408% | 510143 | 5848802 | 8.7222% |
Genetic Differentiation
Summary
Genetic affinities of target population in the context of worldwide populations are measured by pairwise FST between target population and references. Smaller FST value indicates closer relationship. Regions represented by different colors are indicated above.
Genetic Affinity
Summary
Genetic affiliation and population structure are shown by PCA plots. After removing G. g. bankiva, G. g. jabouillei, and some G. g. gallus individuals as outliers to other Red Jungle Fowl, the dataset contains 1,915 samples from domestic chicken and Red Jungle Fowl. User can add any populations with interests to show with the target population under this PCA context by using the item of “Add”.
ADMIXTURE Analysis
Summary
The inference of populations and individual ancestries is revealed by ADMIXTURE clustering. Length of each colored bar represents the proportion of proposed ancestry in the sample. User can add any populations with interests to compare with the target population by using the item of “Add”. The number of proposed ancestries is determined by “which K”.
Runs of Homozygosity
Summary
Runs of homozygosity (ROH) indicates long tracts of homozygous genotypes inherited from identical haplotypes of a common ancestor. Larger populations have fewer, shorter ROH, whereas isolated or bottlenecked populations have more, somewhat longer ROH. Admixture brings the fewest ROH, whereas inbreeding causes long ROH. The level of ROH is measured by number and length. The length of ROH can be defined in “ROH range”. User can add any populations with interests to compare with the target population by using the item of “Add”.
Linkage Disequilibrium Decay
Summary
Linkage disequilibrium (LD) decay is characterized by squared correlations (r²) of all SNPs frequencies against the physical distances between SNPs. User can add any populations with interests to compare with the target population by using the item of “Add”.
Demographic History
Summary
The changes of effective population size through time is inferred by SMC++. User can add any populations with interests to compare with the target population by using the item of “Add”.
Selection
Summary
Selective signals of the target population are detected by different methods. X axis indicates physical position of specific chromosomal region with interests which can be defined by “Region”. The gene annotation is shown below. Y axis of left (YL) indicates the values of Pi-ratio of -log2(πRJF/πTarget) or composite likelihood ratio (CLR) of SweeD. The levels of statistical significance are noted with different colors. Y axis of right (YR) shows the values of Fst (Target vs. Red Jungle Fowl), Pi, or Tajima’s D with blue line with sliding window approach. The genomic window size and step size for Tajima’s D are 5 kb and 5 kb, respectively. The genomic window size and step size for Fst and Pi are 10 kb and 5 kb, respectively. The methods are defined by “Method-YL” and “Method-YR”.
