Background Information

| Breed Card | |
| Breed | Langshan chicken |
| Species taxonomy | Gallus gallus domesticus |
| Classification | Traditional |
| Region | China |
| Purpose | Dual |
Langshans are named after district around eastern China where they were developed over many centuries. There are four distinct types within the breed. The most popular version, is the original utility black Langshan, these became known as Croad Langshans in England, named after Major A.C. Croad, who was the first to import the breed into England 1872. They have lightly feathered shanks and outside toes, and are the most common type of Langshan in the US also. Another popular type is the German Langshan which is also very tall and clean legged. In England the long legged type known as the Modern Langshan was developed more for the show pen and the birds came to resemble the Modern Games. Then there was a shorter legged version resembling the Cochin. These birds were used in the creation of the Orpington.
The Langshan is a tall breed carry themselves as if their heads are held high enhancing their tall elegance. They have long bluish/black legs with feathers covering their shanks and third toe. They have a single comb and white skin. The Lanshan is a dual purpose breed with tasty white meat and large brown eggs some with a deep shade of purple. Hens lay between 200 - 230 rich brown eggs per year, and may go broody too. On avarage, the weights for rooster and hen are 9.5 lbs and 7.5 lbs, respectively.
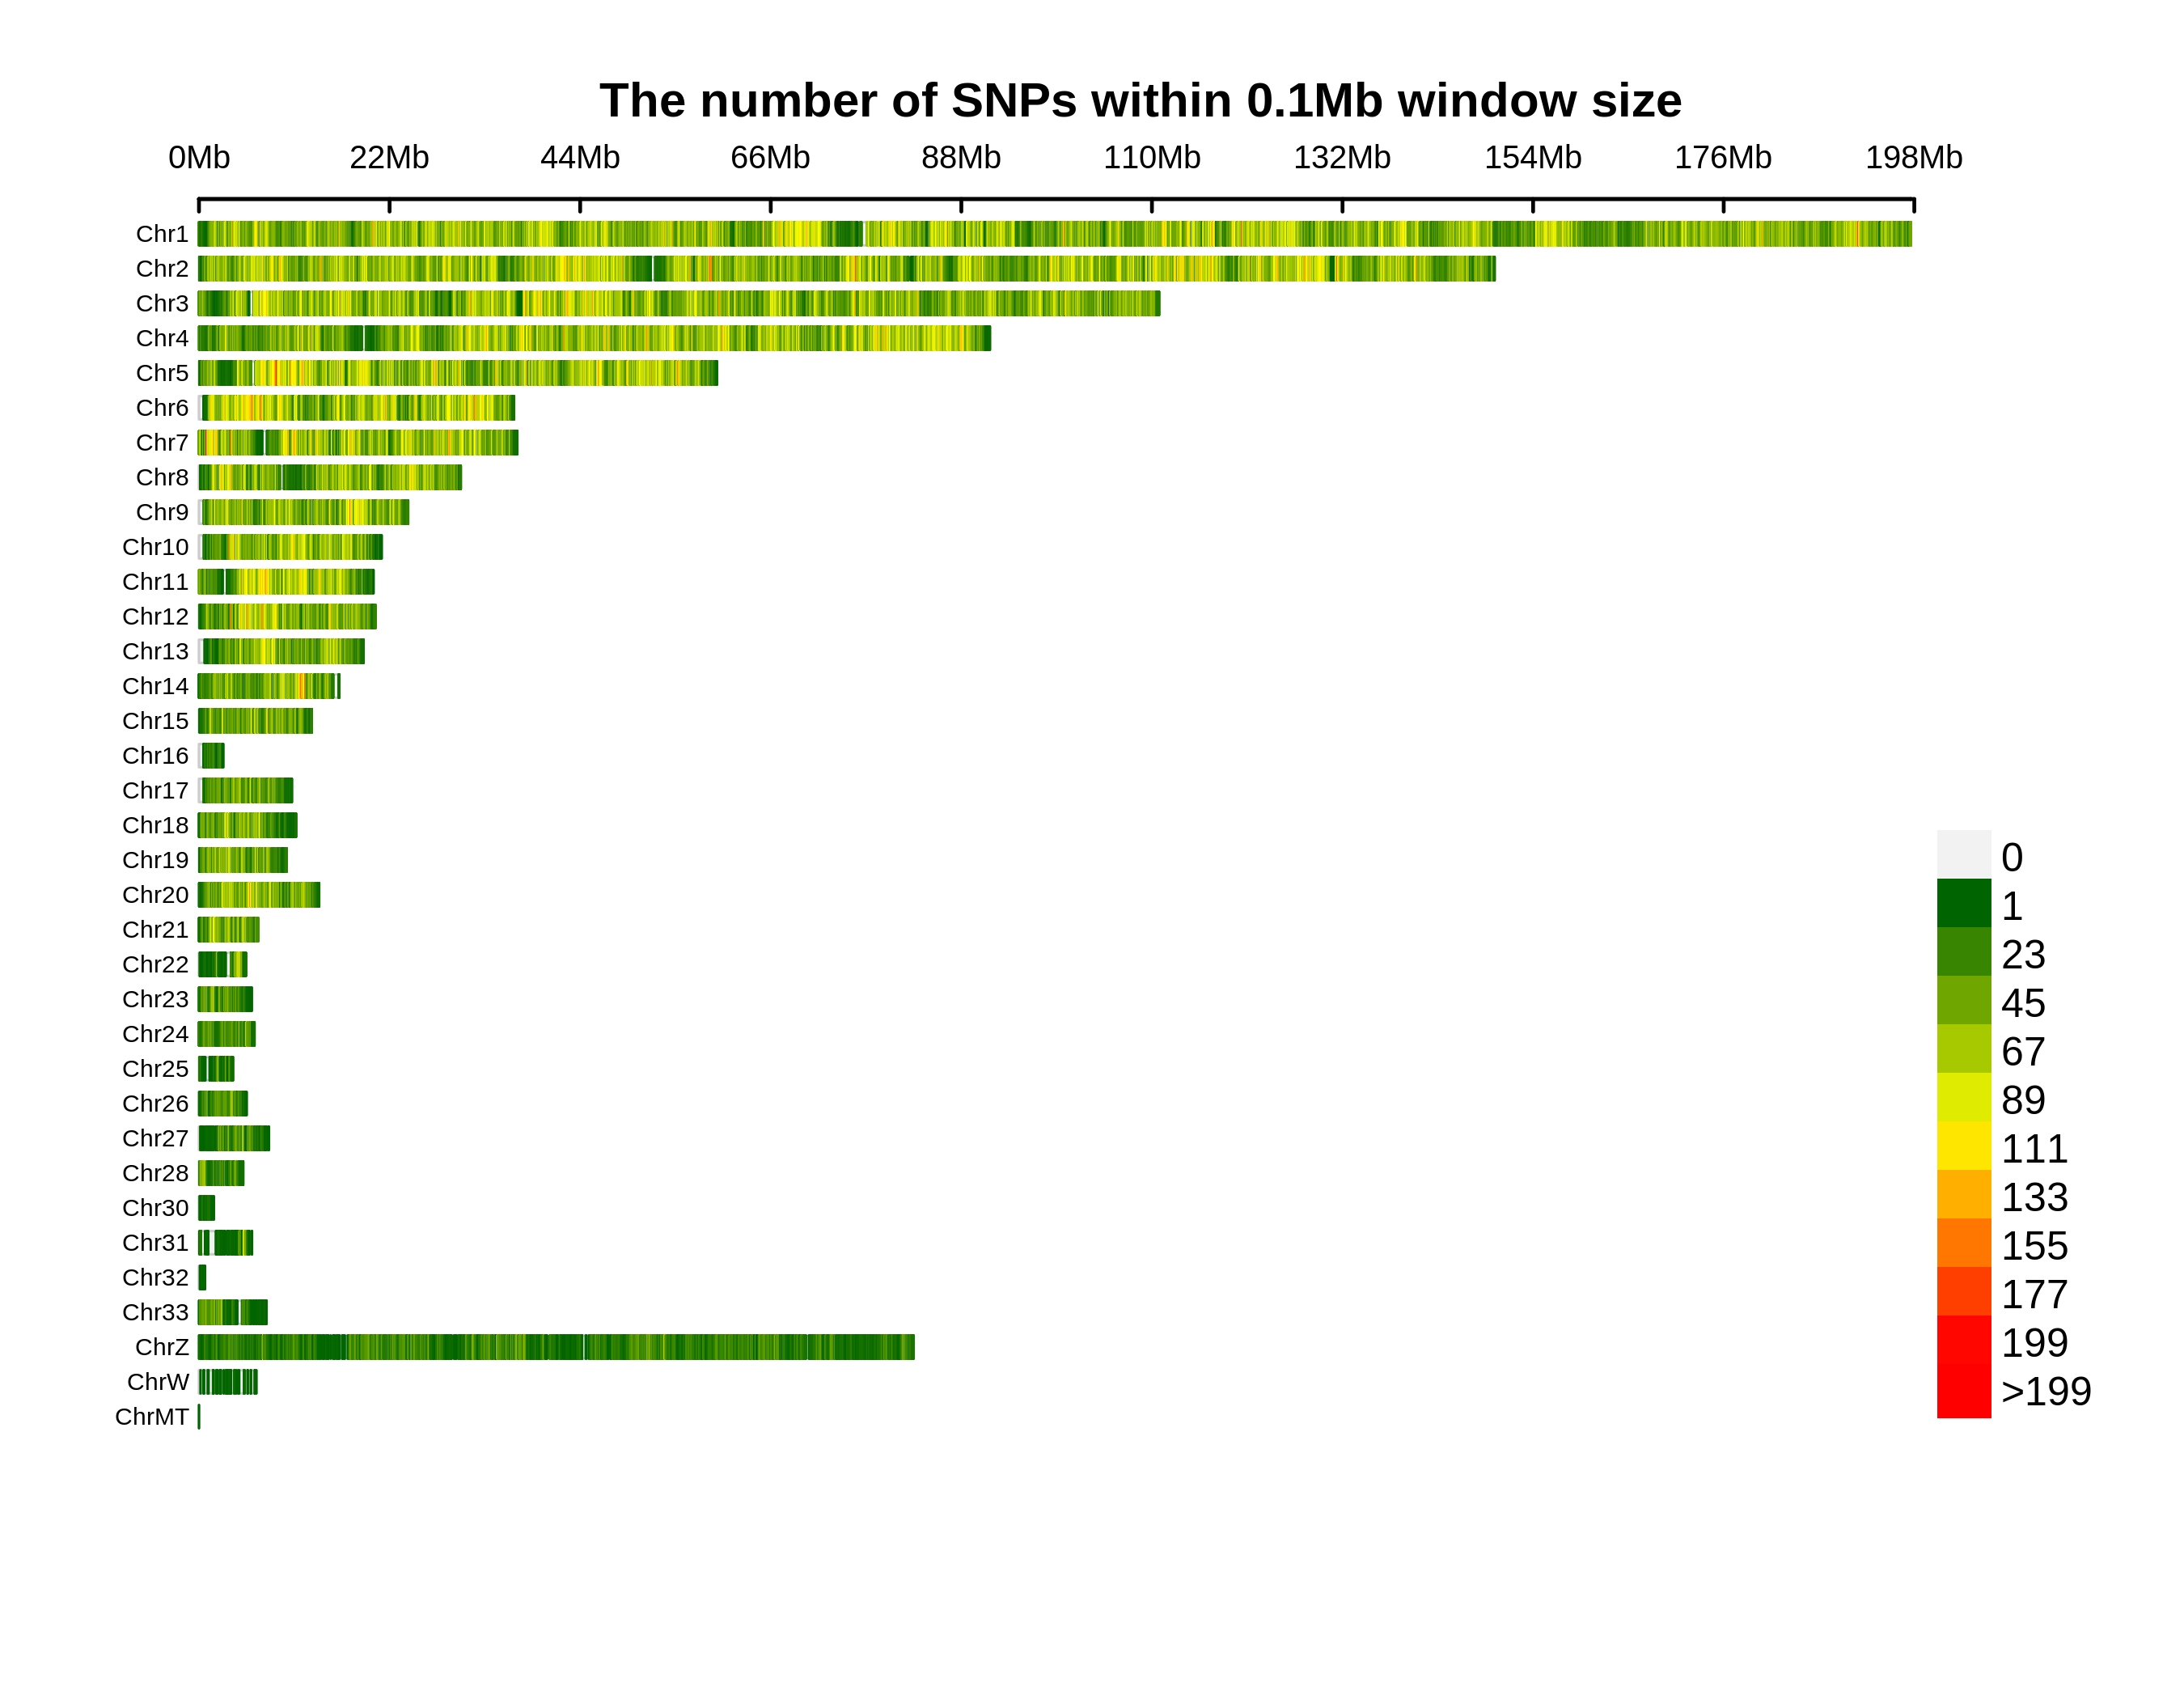
Variants Annotation&Density
| Annotation | Population SNP | Total SNP | Percentage SNP | Population INDEL | Total INDEL | Percentage INDEL |
|---|---|---|---|---|---|---|
| downstream | 92912 | 650455 | 14.2842% | 7925 | 104154 | 7.6089% |
| exonic;splicing | 14 | 188 | 7.4468% | 0 | 0 | 0% |
| exonic_unknown | 8 | 582 | 1.3746% | 0 | 82 | 0% |
| frameshift_deletion | 0 | 0 | 0% | 223 | 15977 | 1.3958% |
| frameshift_insertion | 0 | 0 | 0% | 210 | 13308 | 1.578% |
| intergenic | 2381292 | 15129055 | 15.7399% | 186999 | 2238383 | 8.3542% |
| intronic | 2990657 | 17735594 | 16.8625% | 248978 | 2641780 | 9.4246% |
| ncRNA_exonic | 60797 | 400185 | 15.1922% | 4588 | 54342 | 8.4428% |
| ncRNA_exonic;splicing | 40 | 231 | 17.316% | 2 | 43 | 4.6512% |
| ncRNA_intronic | 621354 | 3728327 | 16.6658% | 52273 | 575920 | 9.0764% |
| ncRNA_splicing | 344 | 2341 | 14.6946% | 41 | 478 | 8.5774% |
| ncRNA_UTR5 | 0 | 0 | 0% | 1 | 18 | 5.5556% |
| nonframeshift_deletion | 0 | 0 | 0% | 177 | 8777 | 2.0166% |
| nonframeshift_insertion | 0 | 0 | 0% | 72 | 4784 | 1.505% |
| nonsynonymous | 18807 | 336233 | 5.5934% | 0 | 0 | 0% |
| splice_acceptor | 46 | 750 | 6.1333% | 40 | 964 | 4.1494% |
| splice_donor | 55 | 1076 | 5.1115% | 18 | 763 | 2.3591% |
| splice_donor_acceptor | 0 | 0 | 0% | 9 | 45 | 20% |
| splice_UTR5 | 33 | 400 | 8.25% | 2 | 106 | 1.8868% |
| splie_Others | 0 | 0 | 0% | 17 | 654 | 2.5994% |
| startloss | 52 | 671 | 7.7496% | 0 | 51 | 0% |
| stopgain | 170 | 4175 | 4.0719% | 9 | 1252 | 0.7188% |
| stoploss | 39 | 353 | 11.0482% | 4 | 63 | 6.3492% |
| synonymous | 47303 | 548813 | 8.6191% | 0 | 0 | 0% |
| upstream | 72817 | 679592 | 10.7148% | 5372 | 98760 | 5.4394% |
| upstream;downstream | 4138 | 57451 | 7.2027% | 350 | 9367 | 3.7365% |
| UTR3 | 46641 | 361040 | 12.9185% | 4386 | 61415 | 7.1416% |
| UTR5 | 7867 | 112990 | 6.9626% | 485 | 16935 | 2.8639% |
| UTR5;UTR3 | 176 | 2524 | 6.9731% | 13 | 381 | 3.4121% |
| Total | 6345562 | 39753026 | 15.9625% | 512194 | 5848802 | 8.7572% |

Genetic Differentiation
Summary
Genetic affinities of target population in the context of worldwide populations are measured by pairwise FST between target population and references. Smaller FST value indicates closer relationship. Regions represented by different colors are indicated above.
Genetic Affinity
Summary
Genetic affiliation and population structure are shown by PCA plots. After removing G. g. bankiva, G. g. jabouillei, and some G. g. gallus individuals as outliers to other Red Jungle Fowl, the dataset contains 1,915 samples from domestic chicken and Red Jungle Fowl. User can add any populations with interests to show with the target population under this PCA context by using the item of “Add”.
ADMIXTURE Analysis
Summary
The inference of populations and individual ancestries is revealed by ADMIXTURE clustering. Length of each colored bar represents the proportion of proposed ancestry in the sample. User can add any populations with interests to compare with the target population by using the item of “Add”. The number of proposed ancestries is determined by “which K”.
Runs of Homozygosity
Summary
Runs of homozygosity (ROH) indicates long tracts of homozygous genotypes inherited from identical haplotypes of a common ancestor. Larger populations have fewer, shorter ROH, whereas isolated or bottlenecked populations have more, somewhat longer ROH. Admixture brings the fewest ROH, whereas inbreeding causes long ROH. The level of ROH is measured by number and length. The length of ROH can be defined in “ROH range”. User can add any populations with interests to compare with the target population by using the item of “Add”.
Linkage Disequilibrium Decay
Summary
Linkage disequilibrium (LD) decay is characterized by squared correlations (r²) of all SNPs frequencies against the physical distances between SNPs. User can add any populations with interests to compare with the target population by using the item of “Add”.
Demographic History
Summary
The changes of effective population size through time is inferred by SMC++. User can add any populations with interests to compare with the target population by using the item of “Add”.
Selection
Summary
Selective signals of the target population are detected by different methods. X axis indicates physical position of specific chromosomal region with interests which can be defined by “Region”. The gene annotation is shown below. Y axis of left (YL) indicates the values of Pi-ratio of -log2(πRJF/πTarget) or composite likelihood ratio (CLR) of SweeD. The levels of statistical significance are noted with different colors. Y axis of right (YR) shows the values of Fst (Target vs. Red Jungle Fowl), Pi, or Tajima’s D with blue line with sliding window approach. The genomic window size and step size for Tajima’s D are 5 kb and 5 kb, respectively. The genomic window size and step size for Fst and Pi are 10 kb and 5 kb, respectively. The methods are defined by “Method-YL” and “Method-YR”.
