Background Information
| Breed Card | |
| Breed | Chigulu chicken |
| Species taxonomy | Gallus gallus domesticus |
| Classification | Traditional |
| Region | China |
| Purpose | Broiler |
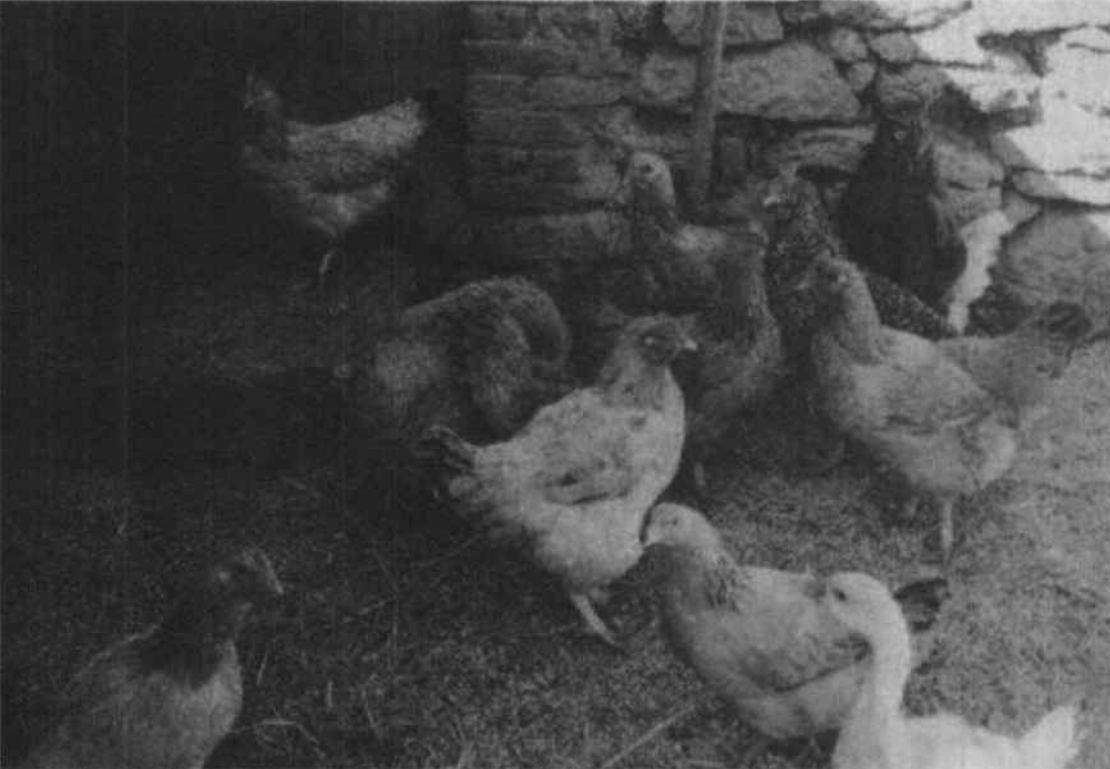
Chigulu chicken is distributed in several yi and lisu groups in huangjiawan village, santai township, south bank of Jinsha and northwest Dayao county, Yunnan province. The traffic is inconvenience of the producing area. The altitude ranges from 1500 to 2600 meters, with an average annual precipitation of 1200 mm and an average air temperature of 14 degree Celsius. As the tail and abdomen is naked when the chick was 1 month old, it is called Chigulu chicken. But after the age of 3 months, adult feathers gradually grow. This breed is a broiler and large in size, good in meat quality and strong in disease resistance. It is a local chicken species not recorded in the catalogue of livestock and poultry species in yunnan province, and the current population is estimated to be 500-1000. Because of the local environment and culture, the species has been preserved as pure and a rare gene pool resources.
Chigulu chicken out of the shell with quill-coverts feather and molt in 1 month old. Before the age of 3 months, only the wing feathers exist. After the age of 3 months, the chicks begin to grow new feathers, and the tail feathers grow slowly. The feather of adult cock is red, the hen has the feather color such as red partridge, white partridge, yellow partridge and white. The head has whisker-like feathers. Most of this chicken breed is single-comb. The tibial toes are blue and the legs are high. At the top of the stamp joint there is a cluster of feathers facing downwards, which is the main mark of this chicken's appearance.The skin is white and black.
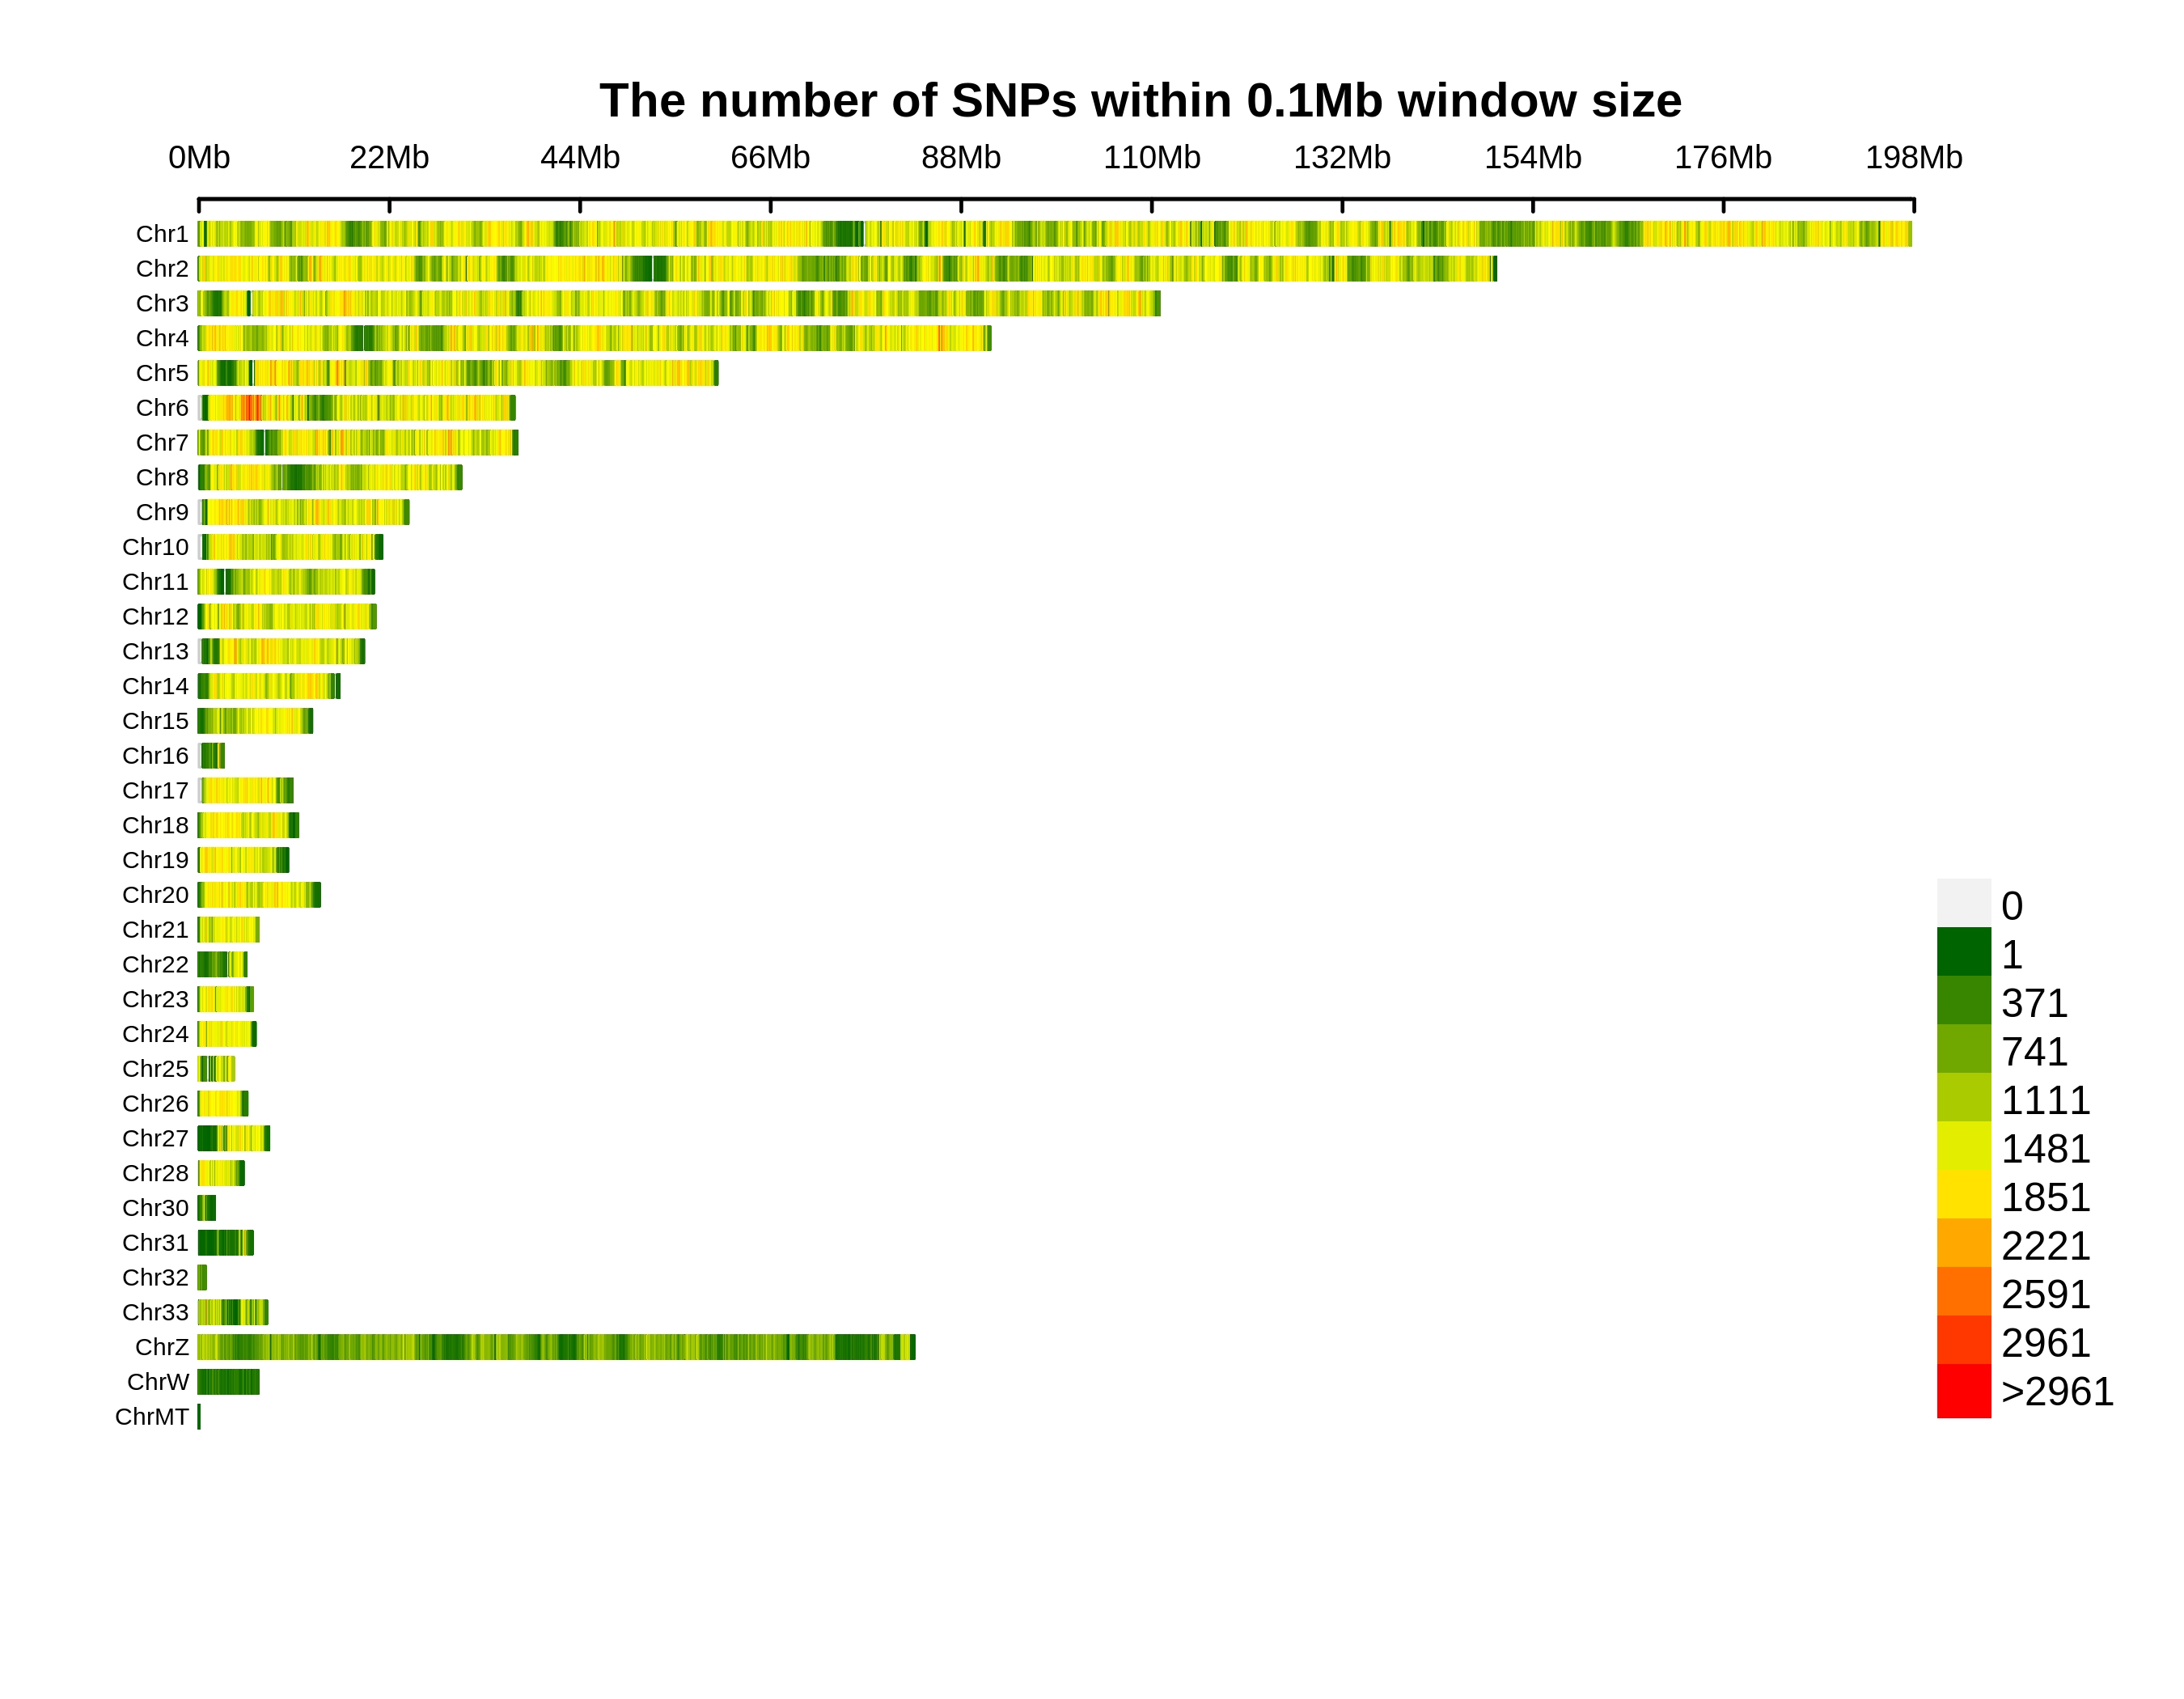
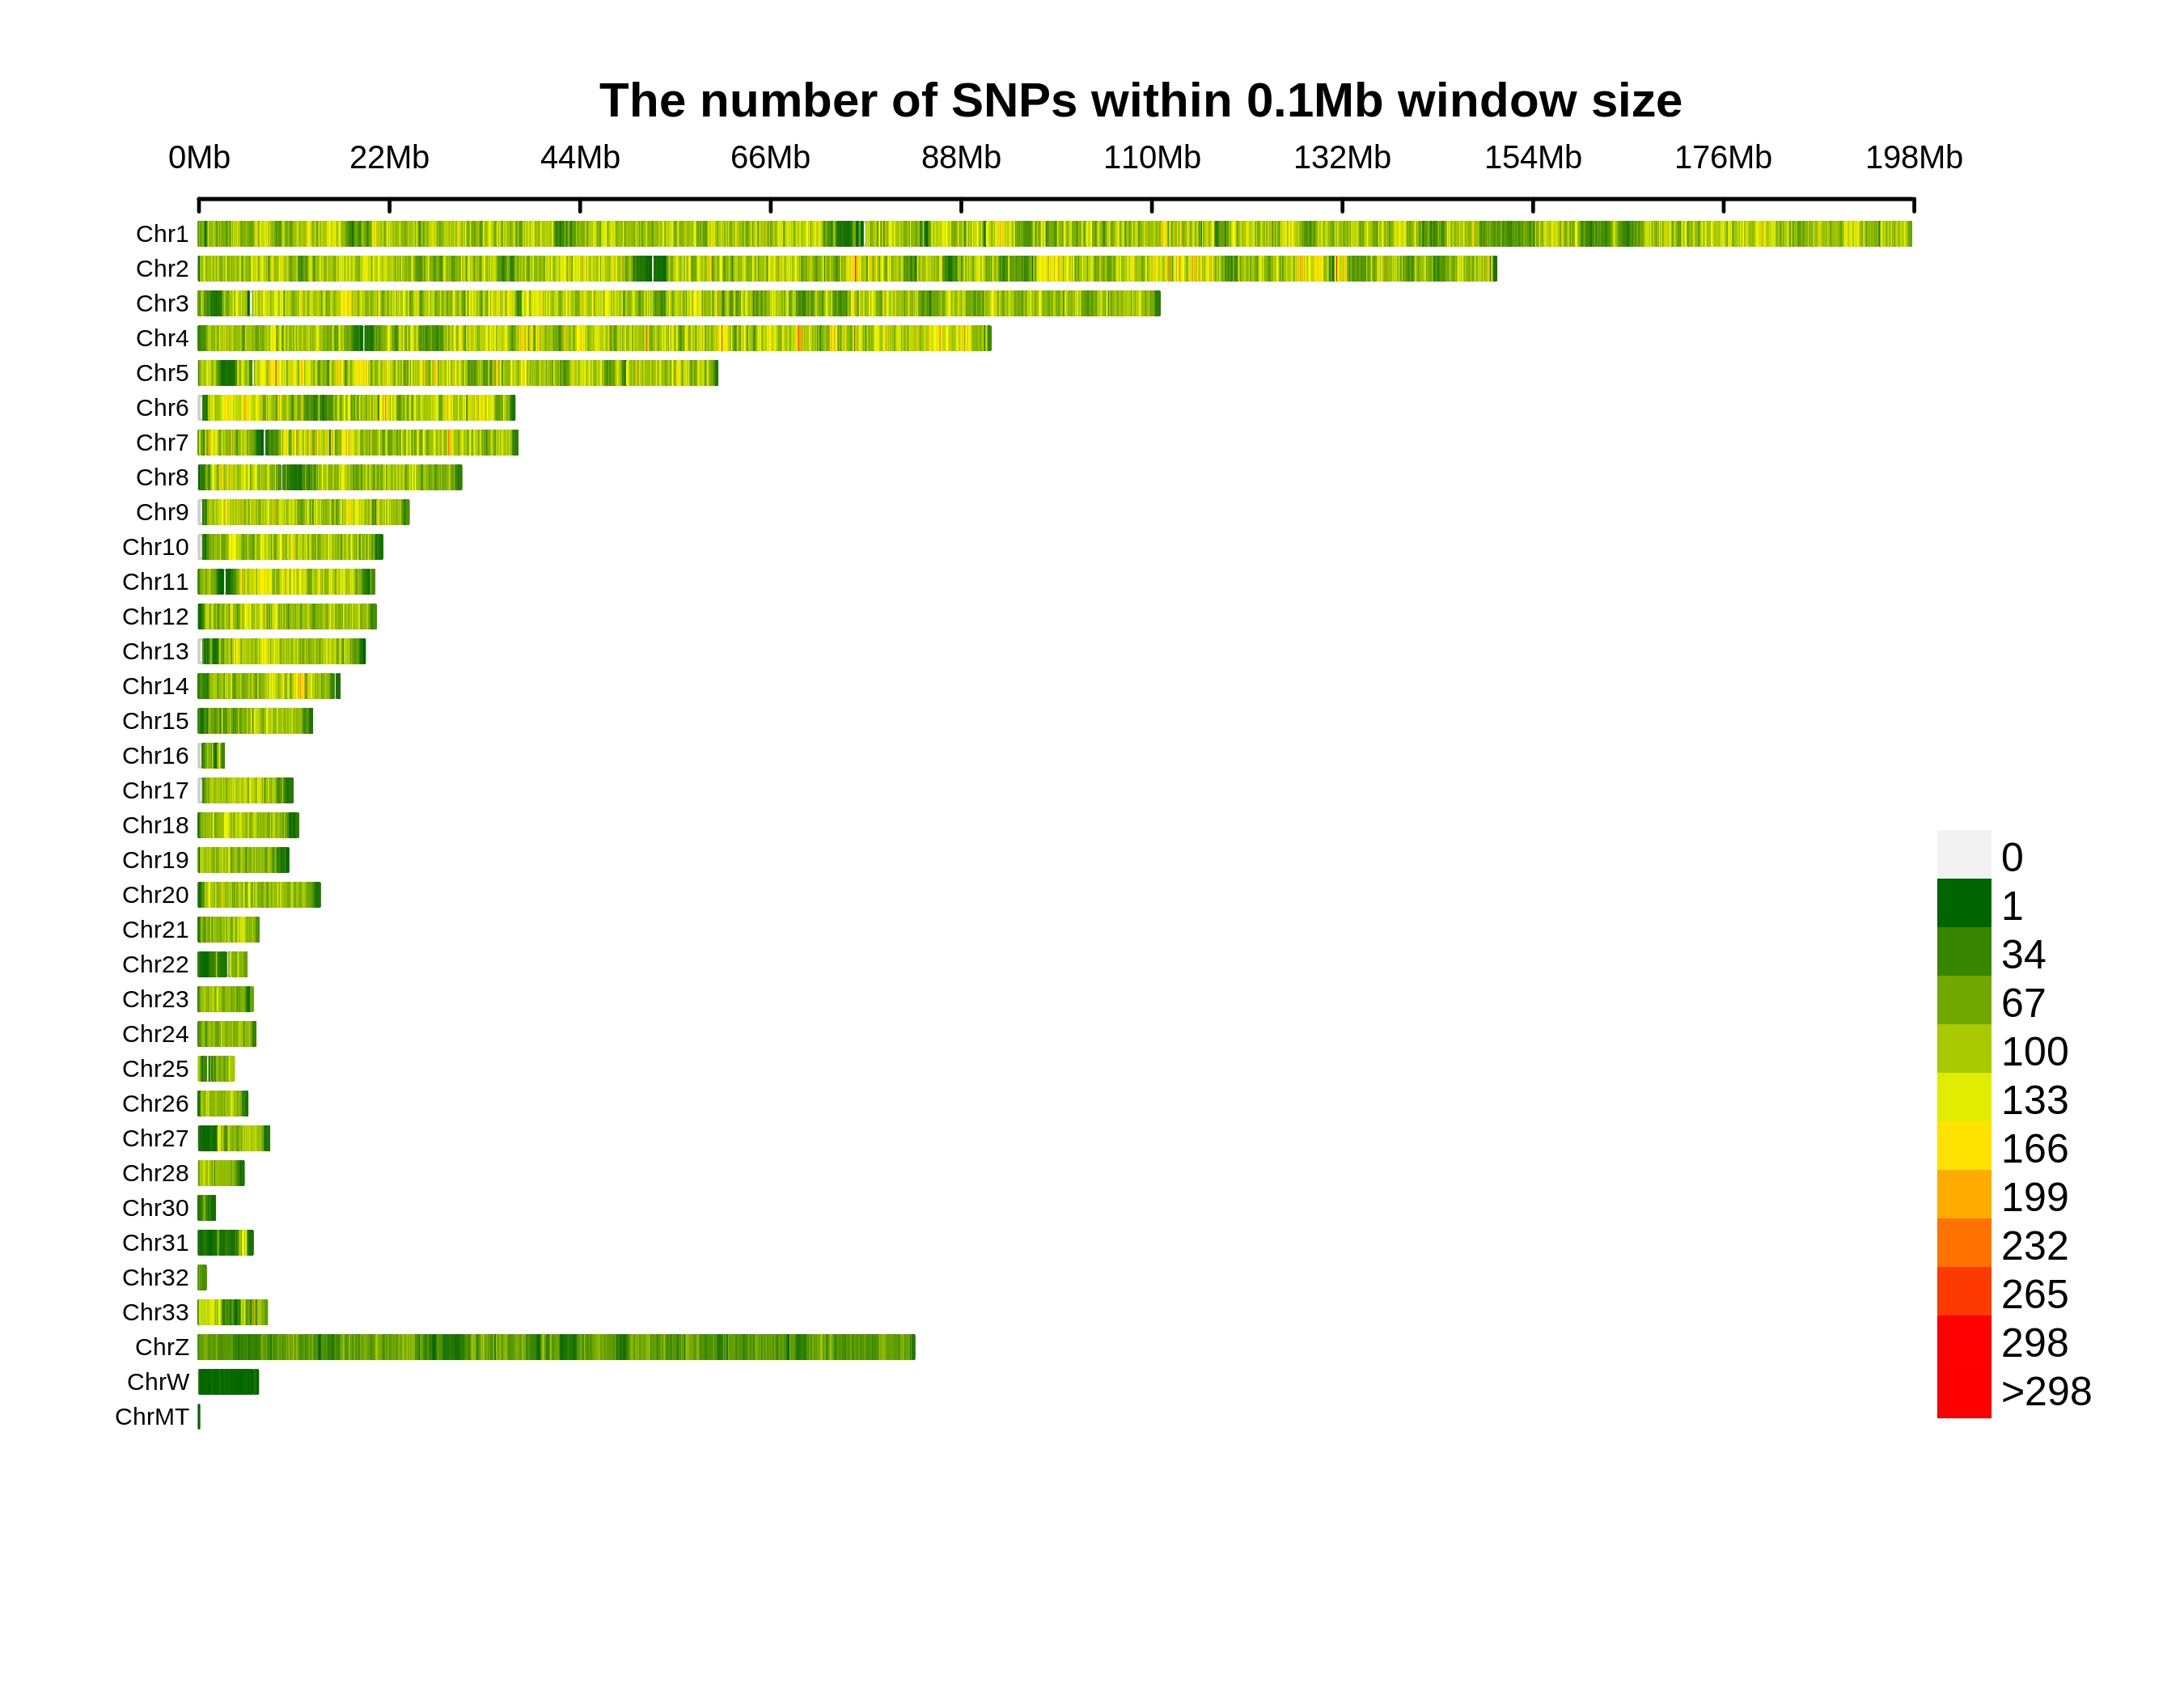
Variants Annotation&Density
| Annotation | Population SNP | Total SNP | Percentage SNP | Population INDEL | Total INDEL | Percentage INDEL |
|---|---|---|---|---|---|---|
| downstream | 179498 | 650455 | 27.5958% | 16179 | 104154 | 15.5337% |
| exonic;splicing | 36 | 188 | 19.1489% | 0 | 0 | 0% |
| exonic_unknown | 30 | 582 | 5.1546% | 0 | 82 | 0% |
| frameshift_deletion | 0 | 0 | 0% | 969 | 15977 | 6.065% |
| frameshift_insertion | 0 | 0 | 0% | 800 | 13308 | 6.0114% |
| intergenic | 4102575 | 15129055 | 27.1172% | 336546 | 2238383 | 15.0352% |
| intronic | 5100923 | 17735594 | 28.7609% | 441136 | 2641780 | 16.6984% |
| ncRNA_exonic | 107215 | 400185 | 26.7914% | 8077 | 54342 | 14.8633% |
| ncRNA_exonic;splicing | 77 | 231 | 33.3333% | 5 | 43 | 11.6279% |
| ncRNA_intronic | 1020834 | 3728327 | 27.3805% | 88599 | 575920 | 15.3839% |
| ncRNA_splicing | 637 | 2341 | 27.2106% | 78 | 478 | 16.318% |
| ncRNA_UTR5 | 0 | 0 | 0% | 1 | 18 | 5.5556% |
| nonframeshift_deletion | 0 | 0 | 0% | 544 | 8777 | 6.198% |
| nonframeshift_insertion | 0 | 0 | 0% | 258 | 4784 | 5.393% |
| nonsynonymous | 49505 | 336233 | 14.7234% | 0 | 0 | 0% |
| splice_acceptor | 123 | 750 | 16.4% | 90 | 964 | 9.3361% |
| splice_donor | 151 | 1076 | 14.0335% | 36 | 763 | 4.7182% |
| splice_donor_acceptor | 0 | 0 | 0% | 22 | 45 | 48.8889% |
| splice_UTR5 | 82 | 400 | 20.5% | 7 | 106 | 6.6038% |
| splie_Others | 0 | 0 | 0% | 45 | 654 | 6.8807% |
| startloss | 161 | 671 | 23.994% | 5 | 51 | 9.8039% |
| stopgain | 526 | 4175 | 12.5988% | 27 | 1252 | 2.1565% |
| stoploss | 83 | 353 | 23.5127% | 9 | 63 | 14.2857% |
| synonymous | 108780 | 548813 | 19.821% | 0 | 0 | 0% |
| upstream | 185419 | 679592 | 27.2839% | 14939 | 98760 | 15.1266% |
| upstream;downstream | 15628 | 57451 | 27.2023% | 1342 | 9367 | 14.3269% |
| UTR3 | 90267 | 361040 | 25.0019% | 8907 | 61415 | 14.503% |
| UTR5 | 26669 | 112990 | 23.603% | 2058 | 16935 | 12.1523% |
| UTR5;UTR3 | 611 | 2524 | 24.2076% | 51 | 381 | 13.3858% |
| Total | 10989830 | 39753026 | 27.6453% | 920730 | 5848802 | 15.7422% |
Genetic Differentiation
Summary
Genetic affinities of target population in the context of worldwide populations are measured by pairwise FST between target population and references. Smaller FST value indicates closer relationship. Regions represented by different colors are indicated above.
Genetic Affinity
Summary
Genetic affiliation and population structure are shown by PCA plots. After removing G. g. bankiva, G. g. jabouillei, and some G. g. gallus individuals as outliers to other Red Jungle Fowl, the dataset contains 1,915 samples from domestic chicken and Red Jungle Fowl. User can add any populations with interests to show with the target population under this PCA context by using the item of “Add”.
ADMIXTURE Analysis
Summary
The inference of populations and individual ancestries is revealed by ADMIXTURE clustering. Length of each colored bar represents the proportion of proposed ancestry in the sample. User can add any populations with interests to compare with the target population by using the item of “Add”. The number of proposed ancestries is determined by “which K”.
Runs of Homozygosity
Summary
Runs of homozygosity (ROH) indicates long tracts of homozygous genotypes inherited from identical haplotypes of a common ancestor. Larger populations have fewer, shorter ROH, whereas isolated or bottlenecked populations have more, somewhat longer ROH. Admixture brings the fewest ROH, whereas inbreeding causes long ROH. The level of ROH is measured by number and length. The length of ROH can be defined in “ROH range”. User can add any populations with interests to compare with the target population by using the item of “Add”.
Linkage Disequilibrium Decay
Summary
Linkage disequilibrium (LD) decay is characterized by squared correlations (r²) of all SNPs frequencies against the physical distances between SNPs. User can add any populations with interests to compare with the target population by using the item of “Add”.
Demographic History
Summary
The changes of effective population size through time is inferred by SMC++. User can add any populations with interests to compare with the target population by using the item of “Add”.
Selection
Summary
Selective signals of the target population are detected by different methods. X axis indicates physical position of specific chromosomal region with interests which can be defined by “Region”. The gene annotation is shown below. Y axis of left (YL) indicates the values of Pi-ratio of -log2(πRJF/πTarget) or composite likelihood ratio (CLR) of SweeD. The levels of statistical significance are noted with different colors. Y axis of right (YR) shows the values of Fst (Target vs. Red Jungle Fowl), Pi, or Tajima’s D with blue line with sliding window approach. The genomic window size and step size for Tajima’s D are 5 kb and 5 kb, respectively. The genomic window size and step size for Fst and Pi are 10 kb and 5 kb, respectively. The methods are defined by “Method-YL” and “Method-YR”.
